
Chart of the Week
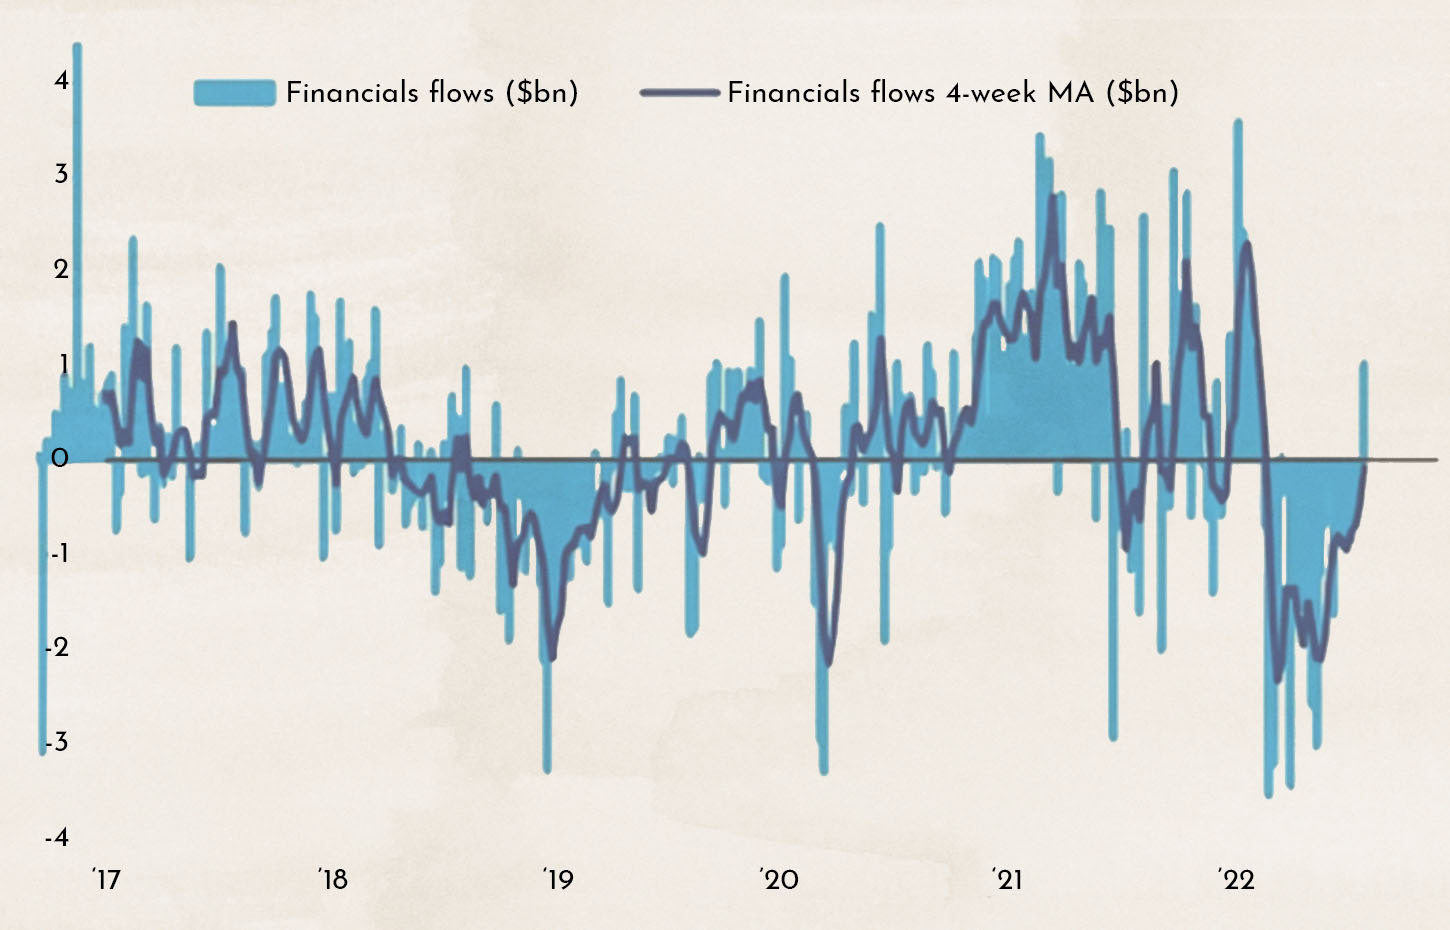
The chart shows how much money flows into the stock market each week. In recent months, this figure had been negative, meaning more people were selling than buying. Last week, that trend reversed.
Why This Matters
Despite all the technical jargon in the stock market, the basic principle is actually quite simple. When more people buy than sell, the market rises, and when more people sell than buy, the market falls.
If it is possible to predict investor buying behavior, this can help partially forecast market price movements.
Normally, investor behavior tends to move in certain trends. There is usually not heavy buying one week followed by heavy selling the next. At the moment, we are seeing strong momentum on the buying side. After weeks of surprisingly high selling volumes, the market had become correspondingly oversold. The positive trend is likely to continue for several more weeks.
Stable Stock Market Despite Uncertainty in Taiwan
Surprisingly, the conflict over Taiwan was not a major topic in the stock market. Market participants consider it unlikely that China would actually attack Taiwan. This attitude is not without risk. Many also believed it was unrealistic that Russia would invade Ukraine.
The majority of the world’s computer and smartphone chips come from Taiwan. A Chinese attack would also put China itself under pressure. China imports chips worth more money than oil. In addition, Xi Jinping is under political pressure. The real estate crisis, in which large parts of the middle class have lost everything they had, the zero-COVID policy, and high youth unemployment of 18% make his third re-election as president far from certain. This may be one reason behind the current threats — an external enemy can unite the country — but also a reason not to strike now. Economic sanctions similar to those imposed on Russia would hit China at a bad time, when the country is already weakened.
The key driver behind the positive market sentiment was the many strong corporate earnings reports (or rather, results that were less bad than feared). Most companies were able to meet or exceed expectations. At the moment, there are no clear signs of a recession.

The chart shows the trend in the total number of jobs in the U.S. outside the agricultural sector (nonfarm payrolls). Jobs in the agricultural sector are highly volatile and dependent on seasonal factors, which is why they are usually excluded from the statistics.
This week, the labor market report was highly anticipated. A large number of new jobs were created again in July. All the jobs lost due to the COVID crisis have now been restored.
The next stock market week will likely be dominated by the release of producer prices. On Thursday, the July reading of the Consumer Price Index (CPI) will be published. A moderate increase of 0.3% is expected (following a rise of +1.3% in June). For the core figure (excluding energy and agriculture), an increase of 0.6% is expected (after a rise of 0.7% in June).
A slowdown in growth is therefore expected. This is being attributed to declining producer prices.

The chart shows the development of producer prices in the U.S. (green, ISM Index) and consumer prices (white, CPI). Producer prices are losing momentum and, with some delay, consumer prices should therefore also begin to correct downward. However, ongoing disruptions from the war in Ukraine and persistent imbalances in global supply chains remain complicating factors.
Another reason why we are currently optimistic is that many market participants are either not invested or only lightly invested at the moment.
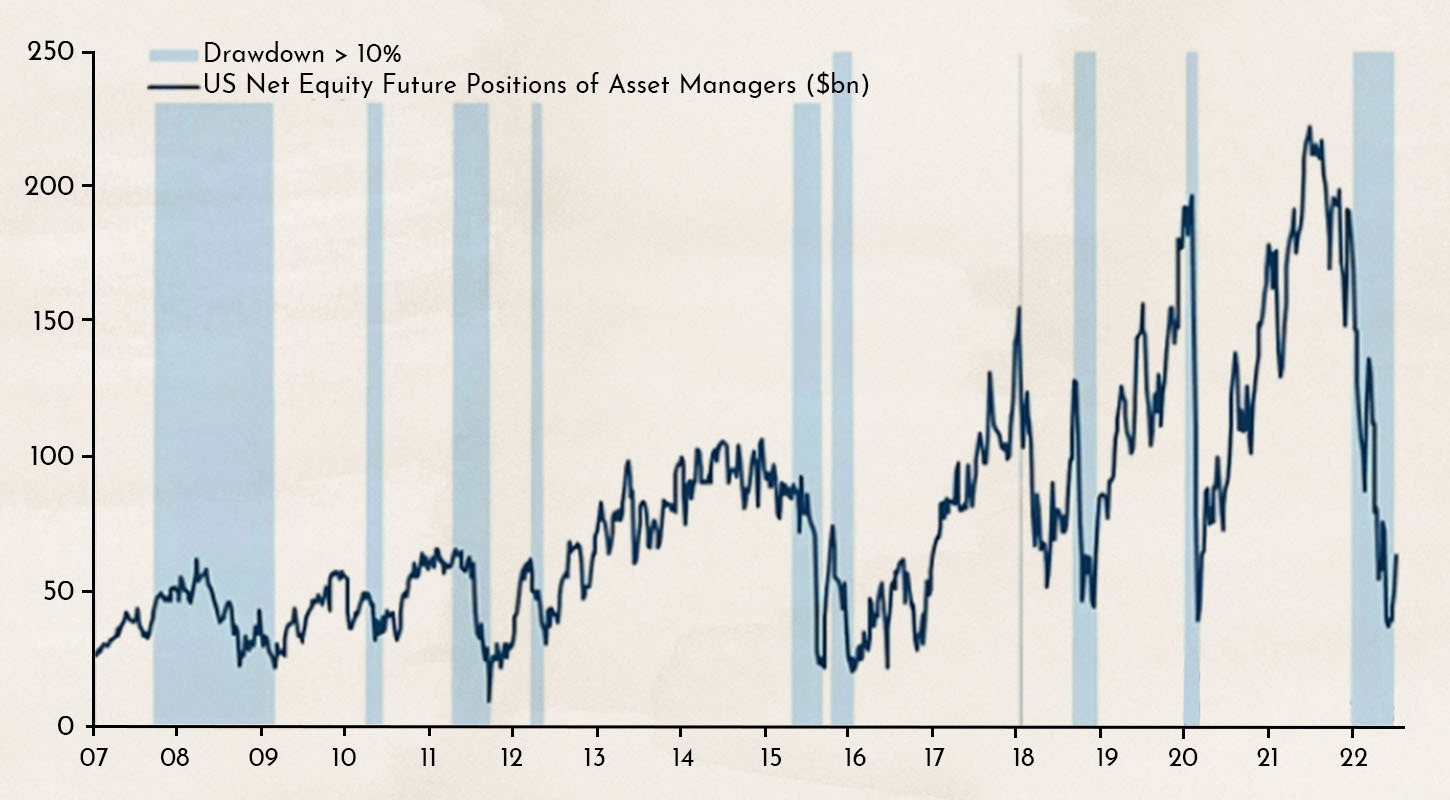
The chart shows the net positioning of institutional investors. It looks at all derivatives positions (futures and options) in which investors are “long” and speculating on rising markets, minus all “short” positions where investors are betting on falling markets.
The value is as low as it has been in a long time. In the past, such low levels have often been followed by a trend reversal and rising stock market values.
How Long Will the Recovery of Growth Stocks Continue?
The ARK Innovation Fund launched by Cathie Wood is well known to many. It is considered an example of an investment strategy focused on the overheated tech companies of recent years. The ETF invests almost exclusively in companies with innovative business models that have never generated a profit and therefore must finance their entire operations through debt. The market valuation of these companies exploded during the COVID period. At one point, the ARK Innovation ETF increased fivefold in value.

The chart shows the performance of the ARK Innovation ETF compared to the NASDAQ during the technology bubble and its collapse from 1998 to 2004.
What hurt the innovative technology companies in the ARK Innovation Fund was the sharply rising interest rates, since their entire business operations have to be financed through debt.

The chart shows the performance of the U.S. technology exchange NASDAQ alongside the yield on 10-year government bonds. What is striking is how inversely the lines move — showing an almost perfect negative correlation. When interest rates rise, the technology market declines, and when interest rates fall (as they have from mid-June until today), the NASDAQ recovers.
Even though the situation on the interest rate front has calmed somewhat, further rate increases are still expected over the next 12 to 24 months. We are therefore maintaining our overweight position in value stocks.
Additional image sources: Opening graphic Designed by Freepik
Disclaimer:
The content in these blogs is intended solely for general informational purposes and to help potential clients gain an understanding of how we work. It does not constitute recommendations to buy or sell assets and should not be considered investment advice. Marmot.Finance cannot assess whether or how the statements made align with your investment objectives or risk profile. If you make investment decisions based on this blog post, you do so entirely at your own risk and responsibility. Marmot.Finance cannot be held liable for any losses that may arise from the information contained in this blog post. The products mentioned are not recommendations but are intended to demonstrate how Marmot.Finance operates and selects such products. Marmot.Finance is completely independent and does not earn compensation from product providers in any form.


.webp)


.jpeg)


.jpeg)

.svg)