
Chart of the Week
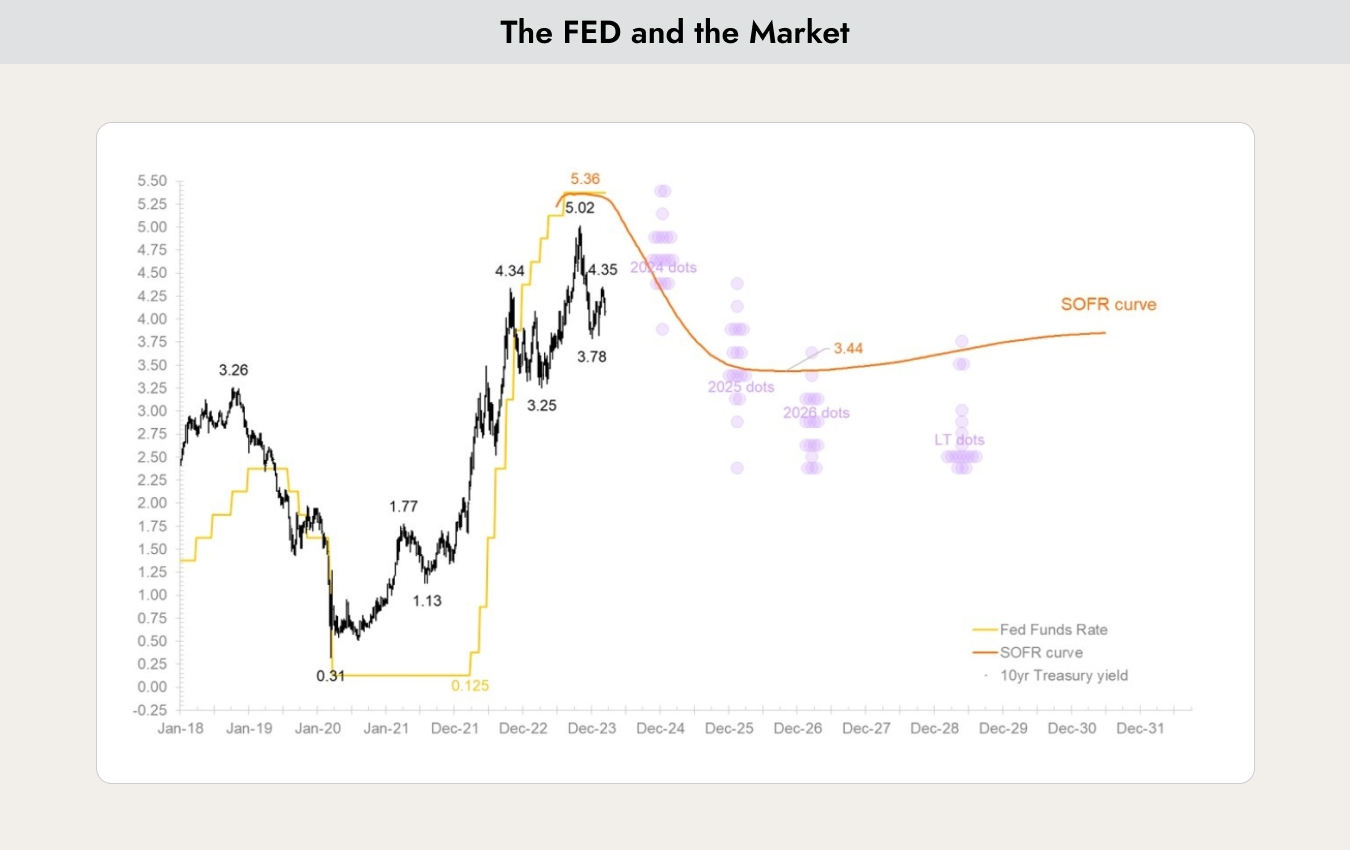
The chart shows the yield of the 10-year U.S. government bond (black), the level of policy interest rates (yellow), expected interest rates based on futures pricing (orange), and the interest rate expectations of the voting members of the U.S. Federal Reserve (purple dots).
Why This Matters
For the development of the stock market, it is crucial how high interest rates are and how they evolve. All market participants, including the voting members of the Federal Reserve, agree that the peak in interest rates has been reached and that rates are expected to decline in the future. It is unlikely that yields on 10-year government bonds will rise above 5% again.
Where there is still considerable disagreement, however, is how long interest rates will remain at their current levels. At the beginning of the year, markets were expecting seven rate cuts; now, only one is expected by the end of the year.
Interest and inflation expectations
In recent weeks, a large amount of data has been published that provides insight into the future path of interest rates.
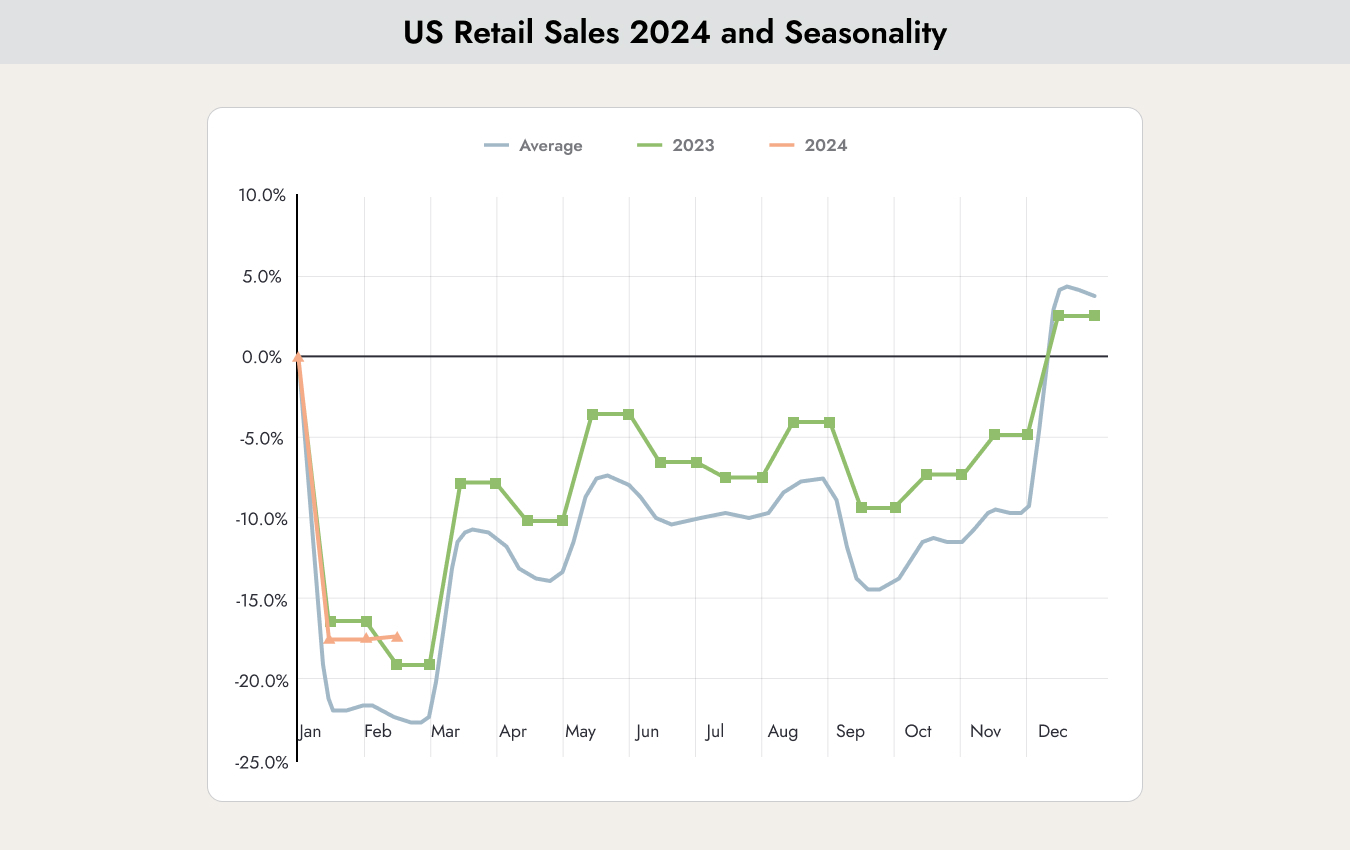
Retail sales came as a slight negative surprise, as they remained very strong. The chart above helps put this into perspective. Retail sales follow a clear seasonal pattern—low at the beginning of the year and highest around Christmas. The blue line shows the average of recent years, the green line reflects last year’s figures, and the red line represents 2024. Retail sales are above the long-term trend and even above last year’s levels, with no signs of a slowdown emerging.
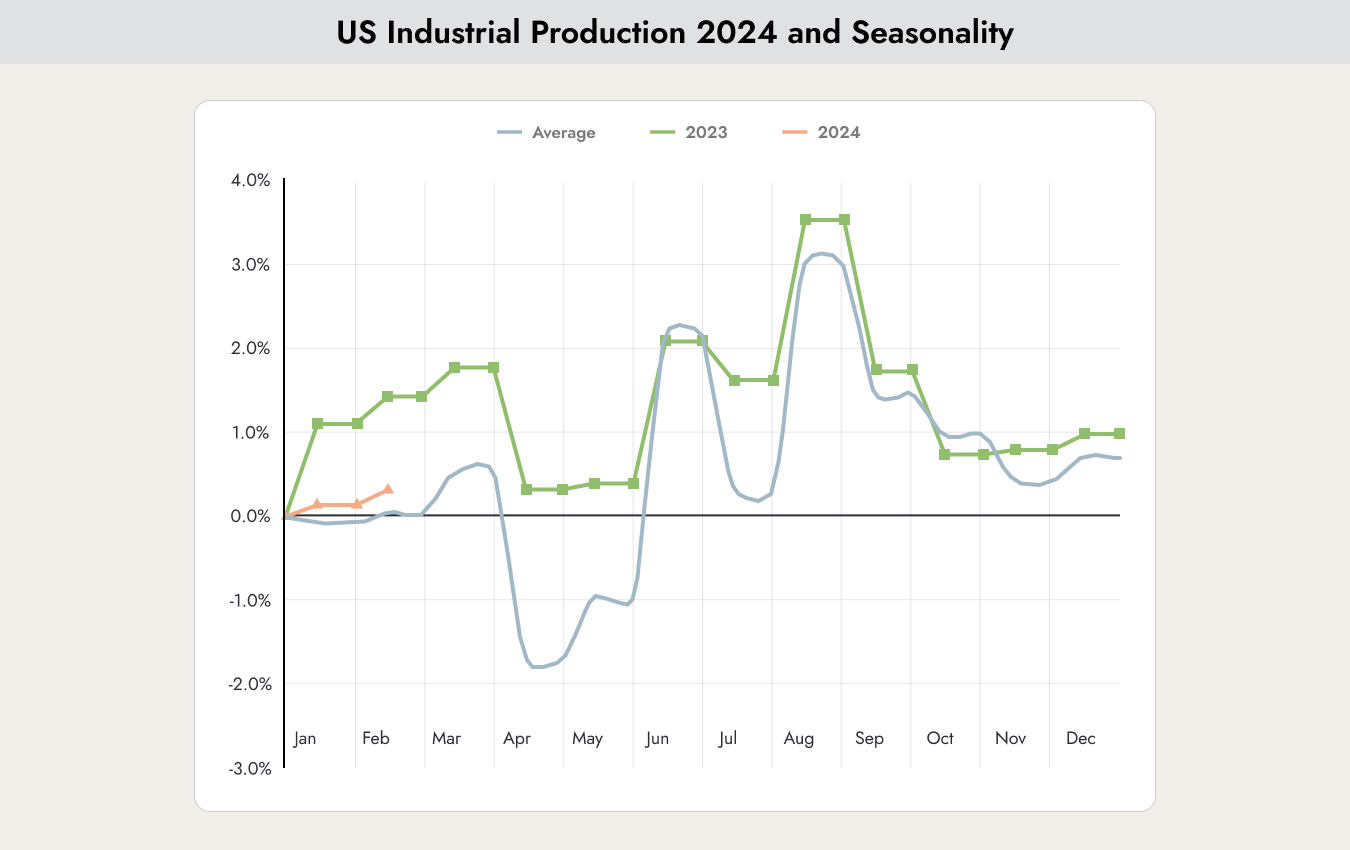
Industrial production (red) was received somewhat more positively. Although it still remains above the long-term trend (blue), it is significantly below last year’s levels. This marks the first clear sign of an economic slowdown. At present, this is being interpreted positively, as it reduces the risk of rising interest rates and fuels hopes for rate cuts.
Inflation, however, is proving more persistent. Last week, February inflation was expected to come in at 3.1%, but the reported figure was 3.2%. Despite signs of economic cooling, inflation is not declining further. Is this a cause for concern?
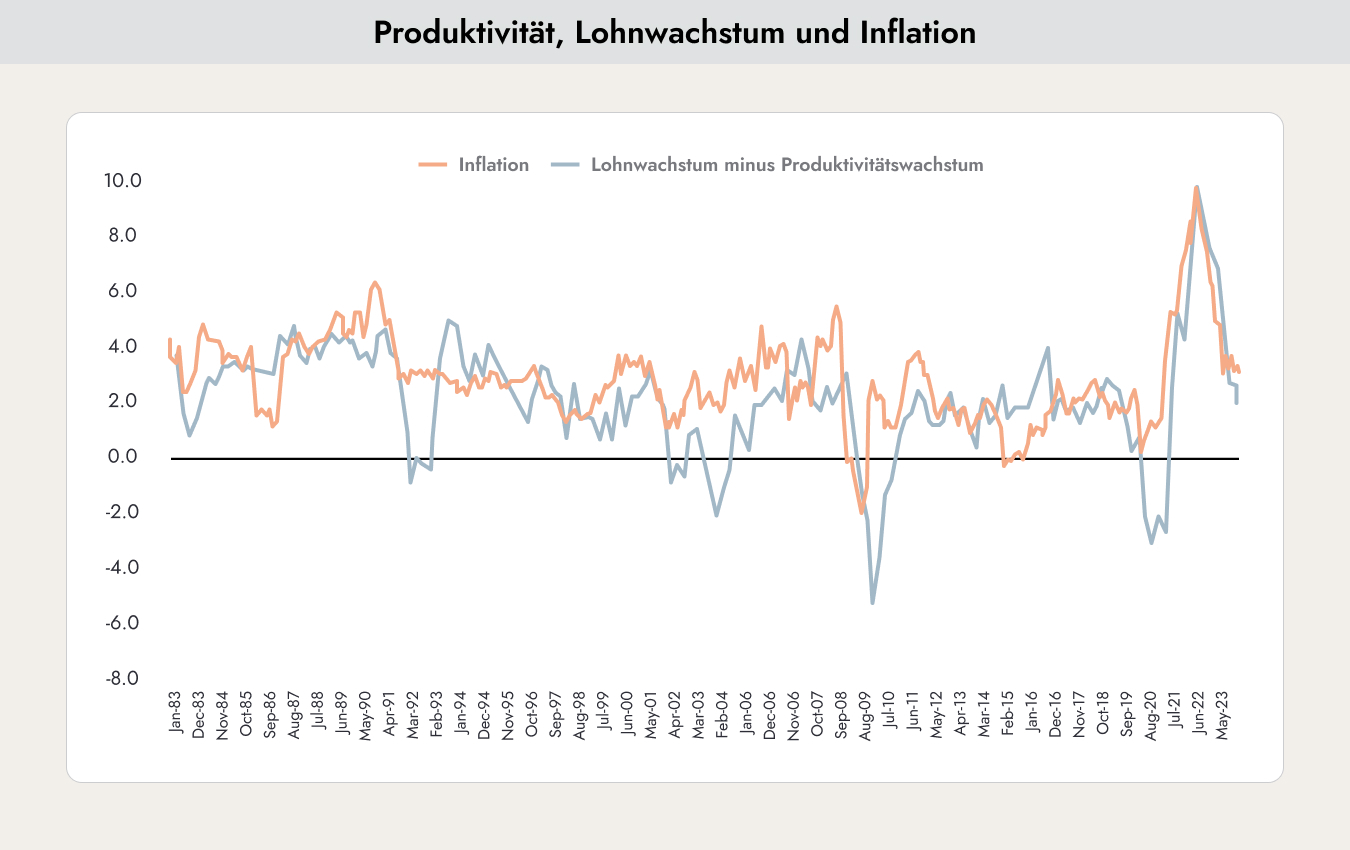
A key driver of inflation, alongside commodity prices, is wage growth. Wage growth becomes particularly concerning when it exceeds productivity growth—something that is not currently the case. As the chart above shows, wage growth minus productivity (light blue) has strong predictive power for inflation (dark blue). Based on this relationship, lower inflation can be expected in the coming months. The main risk to this outlook would be geopolitical uncertainties that could trigger a sharp rise in oil prices.
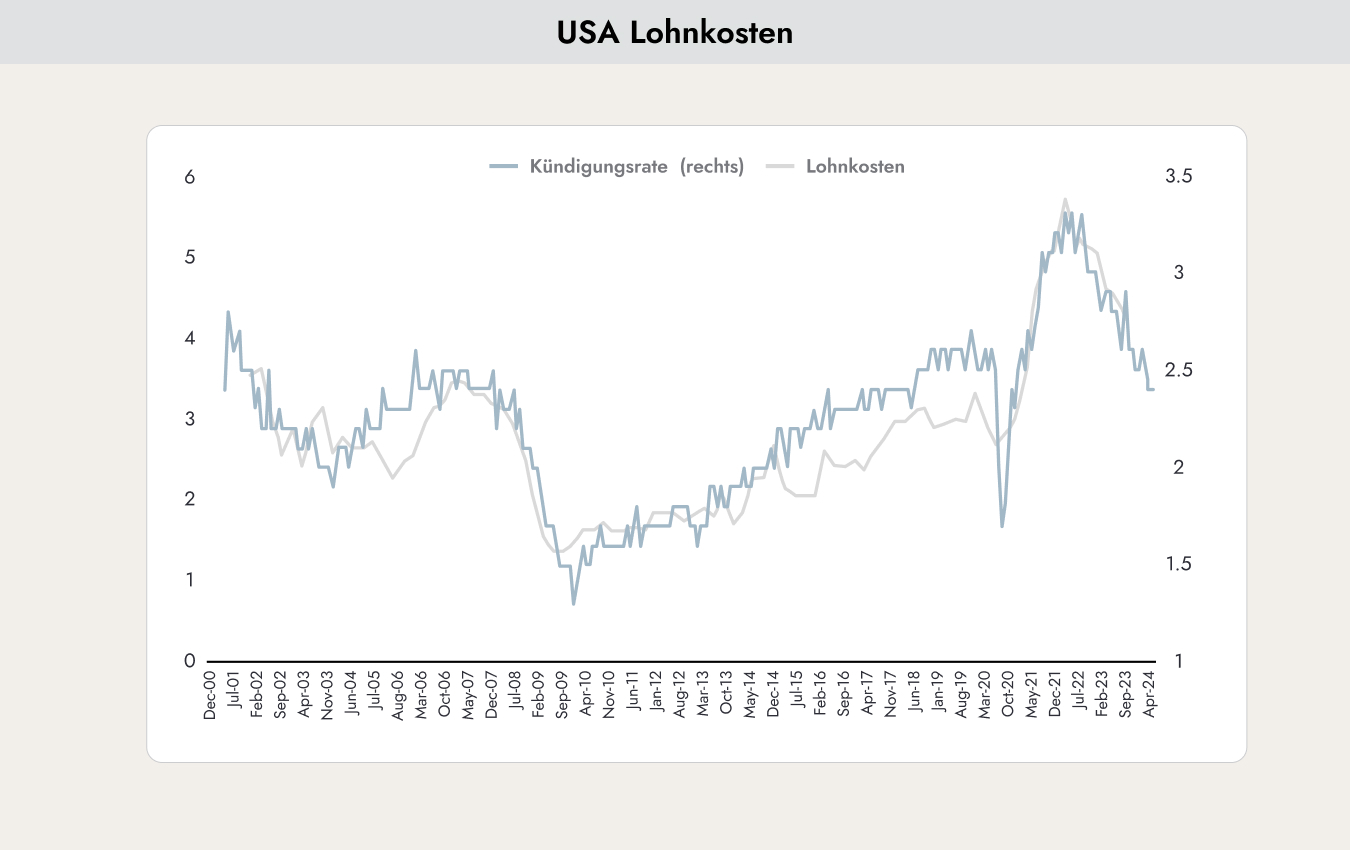
This chart also indicates that labor costs (grey) are expected to decline. A useful indicator of future wage costs is the number of voluntary quits (blue). The fewer people leave their jobs for better opportunities, the lower wage growth tends to be.
However, financial conditions for companies are somewhat concerning. These indicate how easily firms can access financing. Easier conditions are reflected in a rise in the blue line.
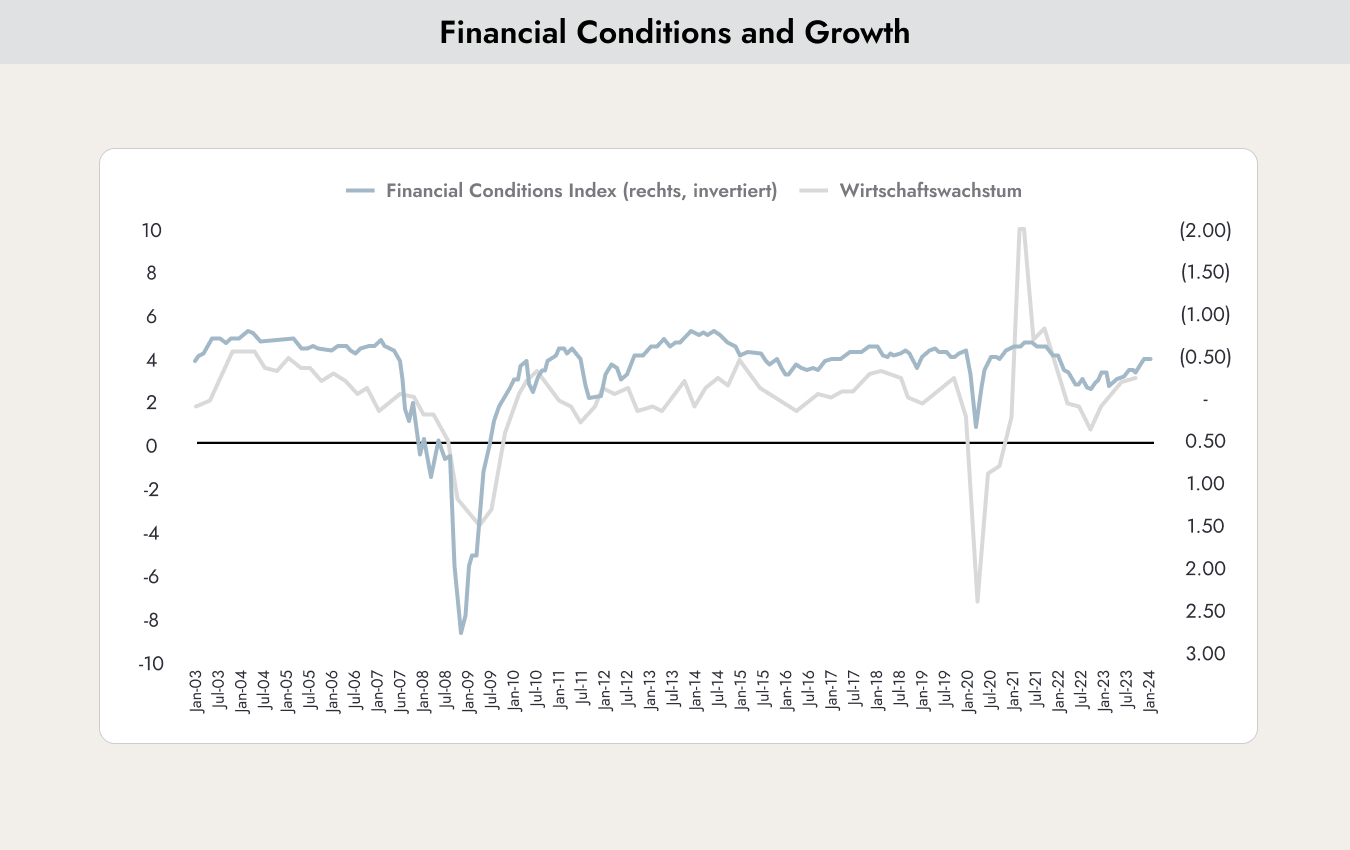
Easier financial conditions for companies lead to increased investment and stronger economic growth (grey), which could prompt the Federal Reserve to hold off on cutting interest rates after all.
At present, positive and negative indicators are broadly balanced. Accordingly, no interest rate cut is expected in the current week.
Government debt and investing in bonds

The chart shows real interest rates (interest rates minus inflation) on government bonds in the respective countries. For investors in USD, the U.S. offers attractive yields, while for investors in EUR, Italy and France provide favorable returns. In contrast, conditions are less attractive for investors allocating in Swiss francs. Without taking on currency risk, investing in bonds is currently not worthwhile.
A key factor for the future performance of government bond prices is the level of government debt.
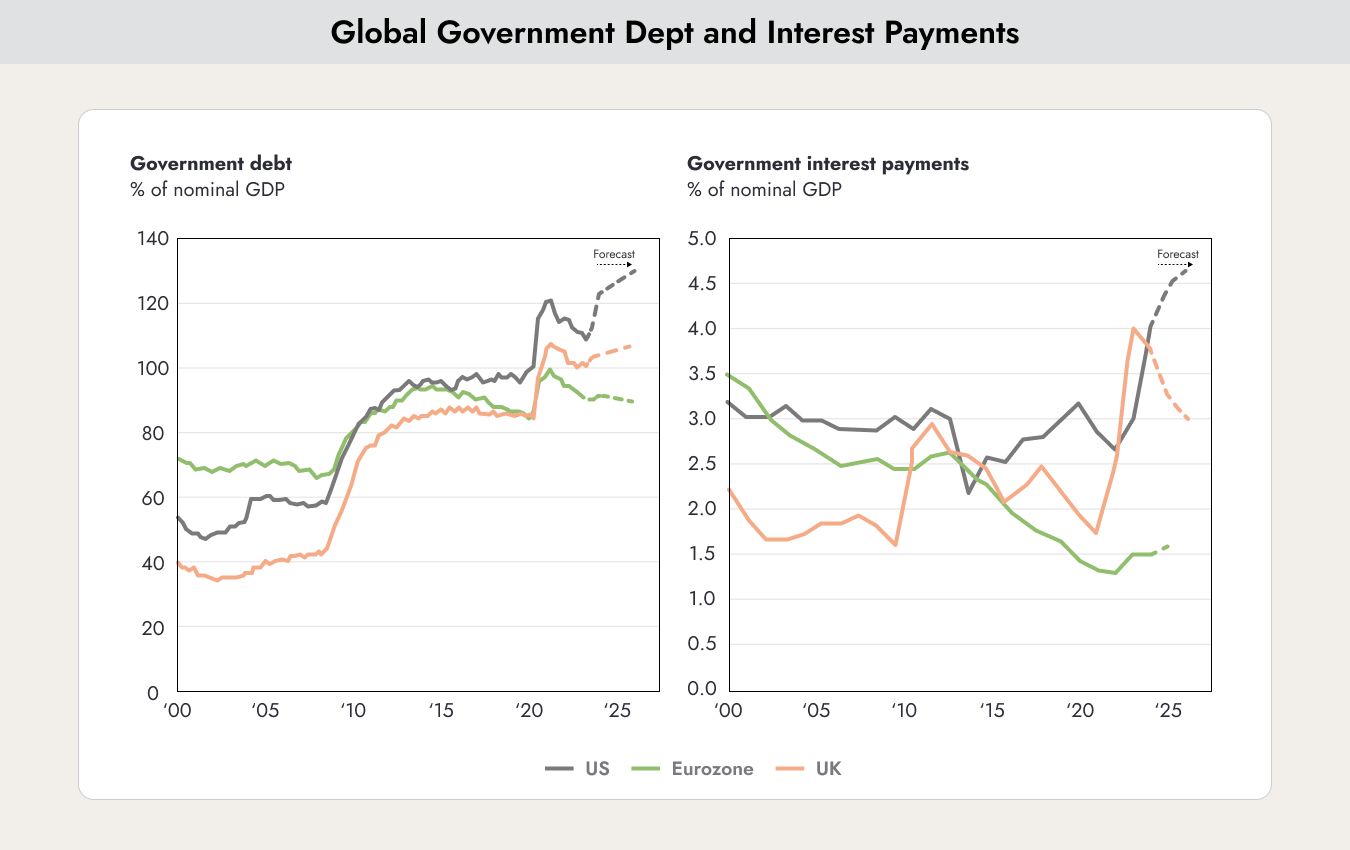
The chart shows projected government debt relative to gross domestic product (left chart). This is comparable to measuring an individual’s annual income against their total debt. With a ratio of around 110, the U.S. (black line) has more debt than it produces in a year. Moreover, U.S. debt is expected to continue rising significantly—potentially even more under a future Donald Trump presidency due to tax cuts than under Joe Biden.
As interest rates in the U.S. have increased, the interest burden on taxpayers has also risen to new record levels. Sooner or later, investors are likely to take this into account again, which could lead to a weaker U.S. dollar. However, since the USD is still regarded as a safe haven in times of crisis, this effect has not yet materialized.
The outlook is more positive in Europe. Government debt relative to GDP is expected to decline somewhat. The amount countries need to spend on interest payments has increased only marginally. Nevertheless, this metric must be monitored closely. If it rises significantly, it could trigger another euro crisis, as some countries may no longer be able to service their interest payments.
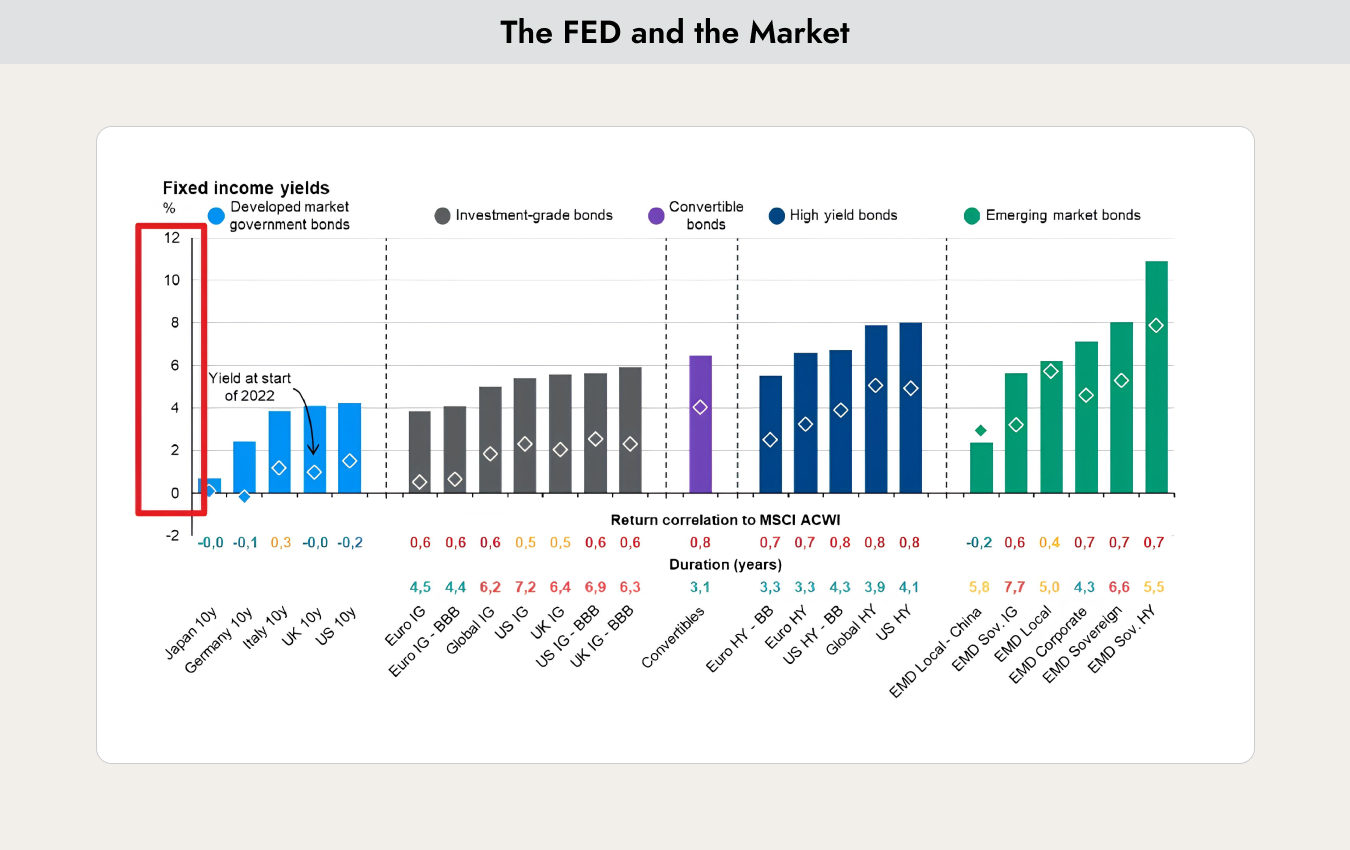
The chart shows the yields currently available across different segments of the bond market. The red scale (left) is particularly important: the higher the risk, the higher the return. Government bonds (blue, left) offer the lowest yields (around 1–4%), while bonds from higher-risk companies and/or emerging markets (green, right) offer the highest yields (around 5–11%).
At first glance, these figures look attractive and suggest good investment opportunities—but currency risk should not be overlooked. For example, Swiss corporate bonds currently yield about 1.3% (e.g., Nestlé bond maturing in 2029), while U.S. corporate bonds offer around 5%, a difference of roughly 3.7%. Sounds like a great deal—but not quite. In 2023, the USD lost about 9.5% against the CHF. Instead of a 1.5% gain, this would have resulted in a 4.5% loss. Sometimes, less is more.
For this reason, we avoid currency risk in bond investments for our clients. When we invest abroad, we do so on a currency-hedged basis.
Given that the risk of a recession still remains, we are currently focusing on government bonds. If a recession occurs, credit spreads on corporate bonds—currently at historically low levels—could widen significantly, leading to losses. Here as well, less is more.

.webp)


.jpeg)


.webp)
.jpeg)
.webp)

.svg)