
Chart of the Week
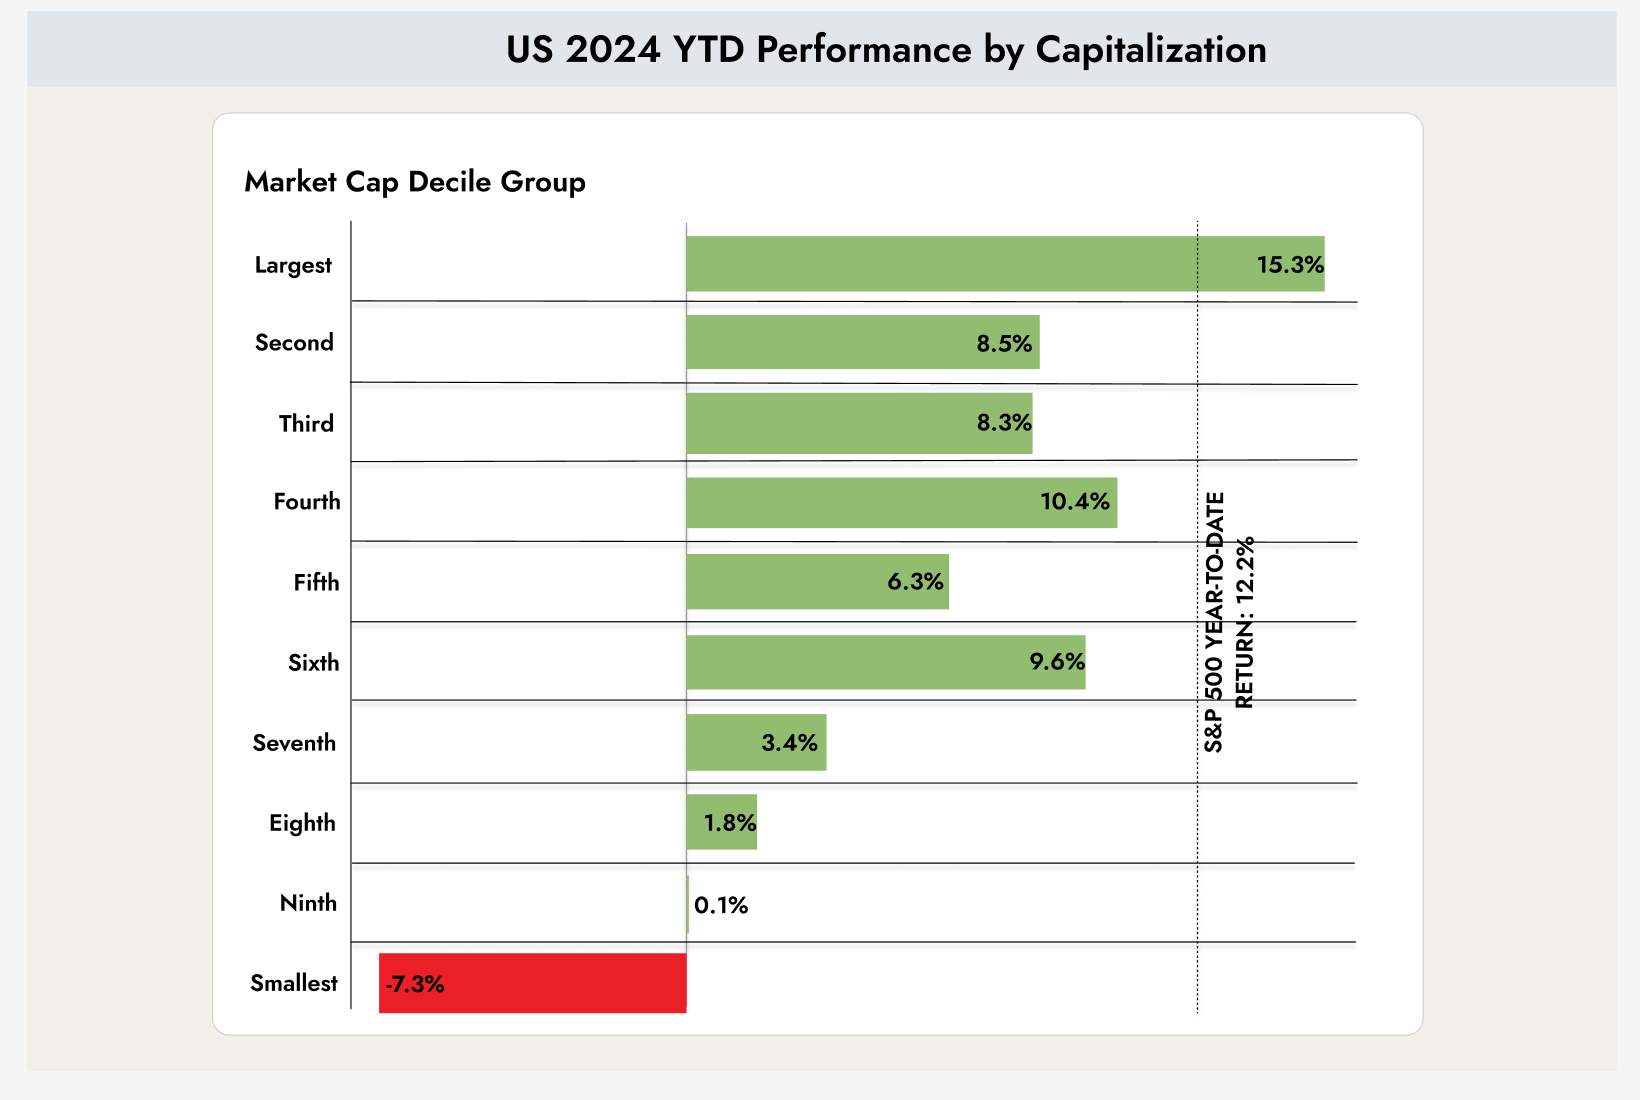
The chart shows the return of the S&P 500 (black vertically hatched line) compared with the returns of companies with different market capitalizations.
Why this is important
In 2024, it has only been possible to outperform the market (S&P 500) in the United States if investments were concentrated in mega caps, meaning companies with the largest market capitalizations. The smaller the market capitalization, the weaker the returns have been.
Aside from the mega caps, the market appears to be positioning itself for a potential recession. In such a market environment, investors face the greatest risks with very small companies, as the probability of bankruptcy is highest in that segment.

The chart shows the profit growth delivered by the top five companies over the past year and the expectations for the coming years. Among these five companies, earnings increased by more than 56%, while the other 495 companies in the S&P 500 recorded growth of only about 4%. In the coming years, the dominance of the top five is expected to decline. However, the time for stocks of smaller companies will likely not arrive until 2025.
At the moment, the portfolio is therefore better positioned toward companies with large market capitalizations.
Interest rates remain stable in the United States
The markets are currently in a state of hesitation as they attempt to process last week’s data. The interest rate cut by the European Central Bank appears to have had little impact on the markets. However, the European elections seem to be creating uncertainty among investors. At the same time, data from the United States suggests that interest rate cuts are becoming less likely.

The chart shows market participants’ expectations regarding upcoming interest rate decisions by the Federal Reserve. The scenario with the highest probability is highlighted in blue. Currently, the Federal Reserve’s target rate range stands between 5.25% and 5.5%.
For the Federal Reserve meeting on July 31, no rate cut is expected. However, cuts are anticipated for the meetings on September 18 and December 18.
For comparison, at the beginning of the year the market expected as many as seven rate cuts. Now, expectations have fallen to just three.

The chart shows the voting behavior and assumptions of each voting member of the Federal Reserve. For 2024, the views are almost identical. However, for 2025 and 2026 there are significant differences in expectations.
One very positive signal is that none of the voting members of the Federal Reserve expect interest rates to rise further. Instead, they anticipate rates remaining stable or declining.
Over the past three months, investors have also lost money in bonds, as the market had to adjust to this new situation. That adjustment now appears to have taken place, and investing in bonds should become safer again.

The Federal Reserve has two main objectives: price stability (low inflation) and full employment. The chart above shows how full employment has developed after the first interest rate hike (the zero line). It distinguishes between cases where the rate hike was followed by a recession (blue, hard landing) and cases where no recession followed (purple, soft landing).
The chart urges caution. The labor market is behaving similarly to previous periods in which a rate hike was followed by a recession. At the same time, it also supports the Federal Reserve’s view that interest rates may move lower in the future.
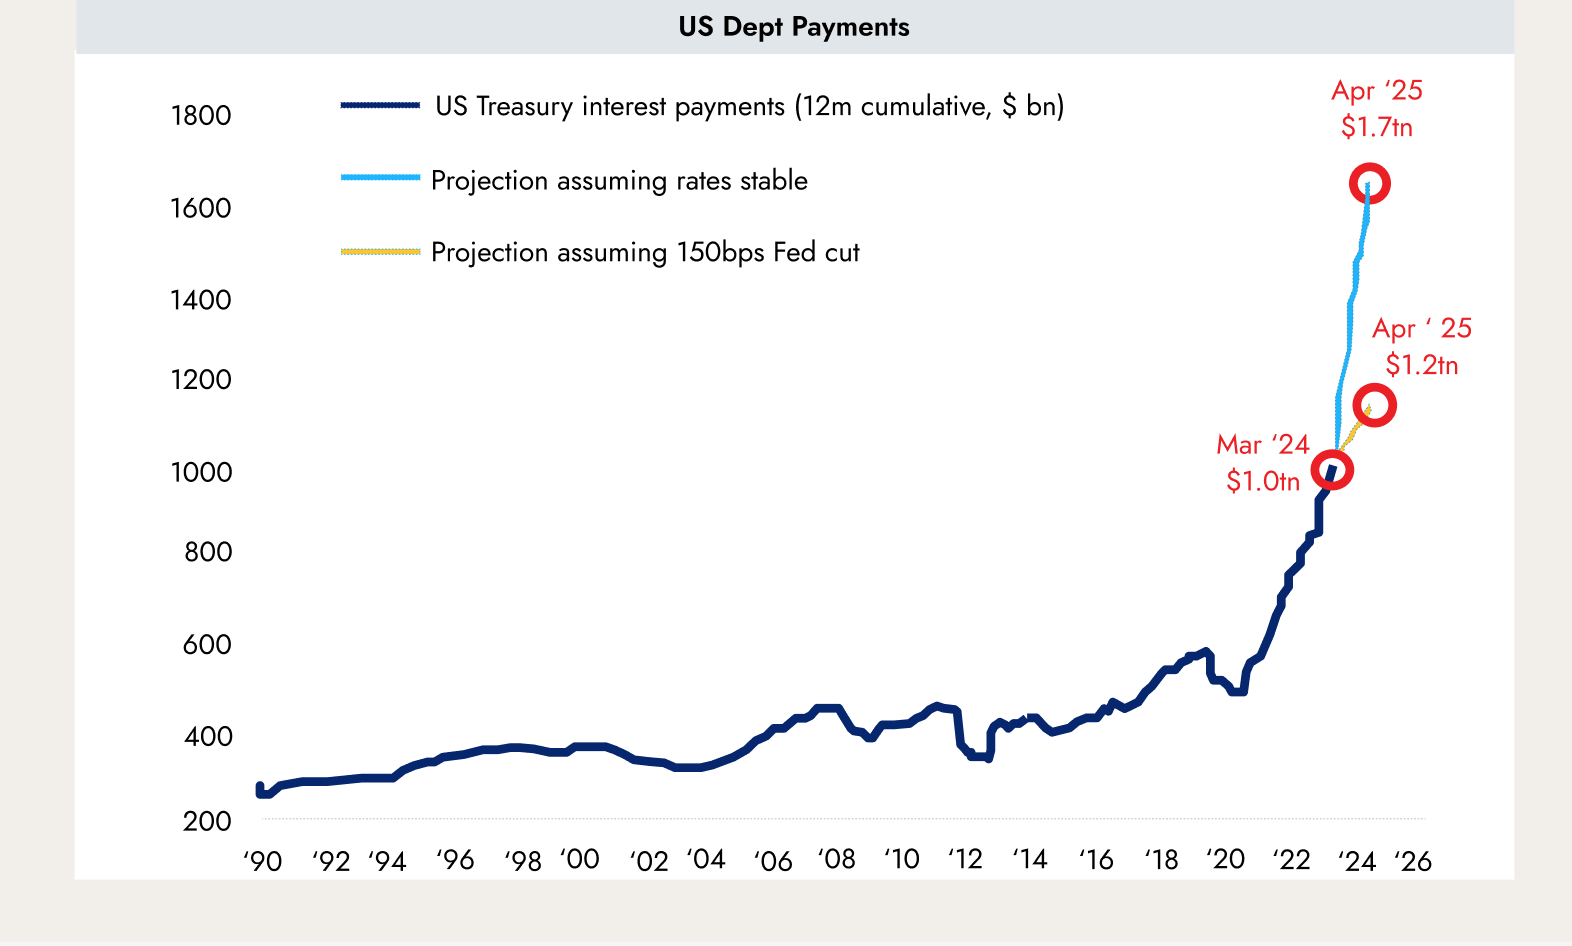
The chart shows how much the U.S. government must spend on interest payments for its bonds. During the period of negative interest rates, these costs were very low, but for new long-term debt the U.S. government now has to pay more than 5%.
If interest rates remain this high for an extended period, interest payments will surge (light blue line) and significantly limit the policy flexibility of the U.S. government, regardless of who becomes the next president. With three interest rate cuts, rates would follow the yellow line. To prevent a debt crisis in the United States, the Federal Reserve may have little choice but to lower interest rates in the near future.
Uncertainty in Europe after the elections
The European elections, the shift toward right-wing parties, and especially the announcement of new elections in France have created significant uncertainty among investors.

The chart shows how the yields of government bonds from France (black), Spain (red), and Italy (blue) have behaved compared with government bonds from Germany.
These so-called spreads are always a good indicator of market stress.

The chart shows the weekly change in the spreads between French and German government bonds. The increase was the largest in more than 10 years.
French President Emmanuel Macron is taking a significant risk with the early elections, potentially making the country difficult to govern. If the parliamentary results mirror those of the European elections, the parliament could reject his proposals during the remaining two years of his presidency. It remains to be seen how voters will decide.
For now, it may be wiser to wait before buying government bonds from France, Spain, and Italy.

.webp)


.jpeg)


.webp)
.jpeg)
.webp)

.svg)