
Chart of the Week
The chart shows the average annual performance of the S&P 500 since 1990 (black and grey). The red line shows this year’s current market performance.

Why This Matters:
Investors often behave according to certain patterns that can be explained by the theory of mass psychology. One of the most frequently quoted stock market rules is: “Sell in May and go away, but don’t forget to come back in September or October.” Stock market returns are typically weak between May and October. Historically, however, investors needed to be invested by October in order not to miss the Christmas rally.
Strong quarterly earnings push US stock market to a new all-time high
So far, 84% of all companies that have reported third-quarter earnings have delivered positive surprises. This is an exceptionally high figure. This has led the S&P 500 to reach a new all-time high.

The chart shows the price development of the S&P 500 index over 20 years. In the past 13 months, since the Covid crisis crash, the price has doubled.
However, one should not become too euphoric now. Looking a bit deeper into price action, the first warning signs are already emerging.
Of the companies that reported earnings and also beat expectations, their share prices rose by only 0.2% in the following days. This is the lowest level in the past five years. This indicates that upside potential is significantly diminishing. At the same time, companies that failed to meet expectations were heavily punished.

The chart shows the returns of S&P 500 stocks that failed to meet earnings expectations. On the day after the earnings announcement, these stocks fell by more than 4% on average. This is the highest level in four years.
This is a clear indication that investors are more nervous than they admit.
Regular readers of this blog are already very familiar with the following chart. The CNN Money Fear & Greed Index shows how euphoric investors are.

The indicator is a so-called contrarian indicator. When too many investors are euphoric and have already invested as much as they can in stocks, a correction becomes likely.

The chart shows the development of the Fear & Greed Index since 2019. In 2021, the stock market rose strongly, but investors became increasingly fearful. This trend has now clearly broken. At the last all-time high in early September, the indicator was still in “Extreme Fear,” indicating strong fear among investors.
Back then, our conclusion was clear: the upward phase in the stock market would continue. Now we are no longer so certain. The likelihood that we will not see a pronounced Christmas rally this year is increasing.
Bitcoin price rises by 50% in 3 weeks
After China declared Bitcoin illegal a few weeks ago, the price of Bitcoin and all other cryptocurrencies dropped sharply. Now, a positive announcement from the US securities regulator has pushed the Bitcoin price up by 50% in just a few weeks.
The US securities regulator has approved a Bitcoin ETF (Exchange Traded Fund) for the first time. This is a notable development. With such a financial product, banks and asset managers worldwide could integrate Bitcoin into standard investment portfolios. Billions in investment capital could now flow into Bitcoin.
Is this assumption realistic? Yes and no. In general, interest in Bitcoin is increasing, and large banks are beginning to take a closer look at Bitcoin. BUT it will not happen as quickly as most investors expect. The newly approved product, the ProShares Bitcoin Strategy ETF (BITO), is not suitable for long-term investors.
To understand this, one needs to look at the structure of the ETF. The ETF does not invest in Bitcoin directly, but in futures contracts linked to Bitcoin. Futures are forward contracts with a clearly defined maturity date. Here is an overview of current prices:

The ProShares ETF therefore has to sell its current futures each month as they expire and roll into the next month’s futures contracts. In technical terms, it has to “roll” its entire portfolio into the next expiry date. As shown in the table, the November futures price is about 1% higher than the October contract. The same applies to the following months. During this rollover process, investors effectively lose around 1% of return compared to the official Bitcoin spot price. For short-term investors this is not an issue, but for long-term investors this can result in a performance drag of at least 12% per year.
To trigger the massive wave of investment capital that many are now expecting, different products are needed—ETFs that are allowed to physically hold Bitcoin. Regulatory approval for such products has not yet been granted.
It was interesting to observe how major US banks addressed the topic last week. In particular, the two large institutions JPMorgan and Fidelity attracted attention with striking forecasts.
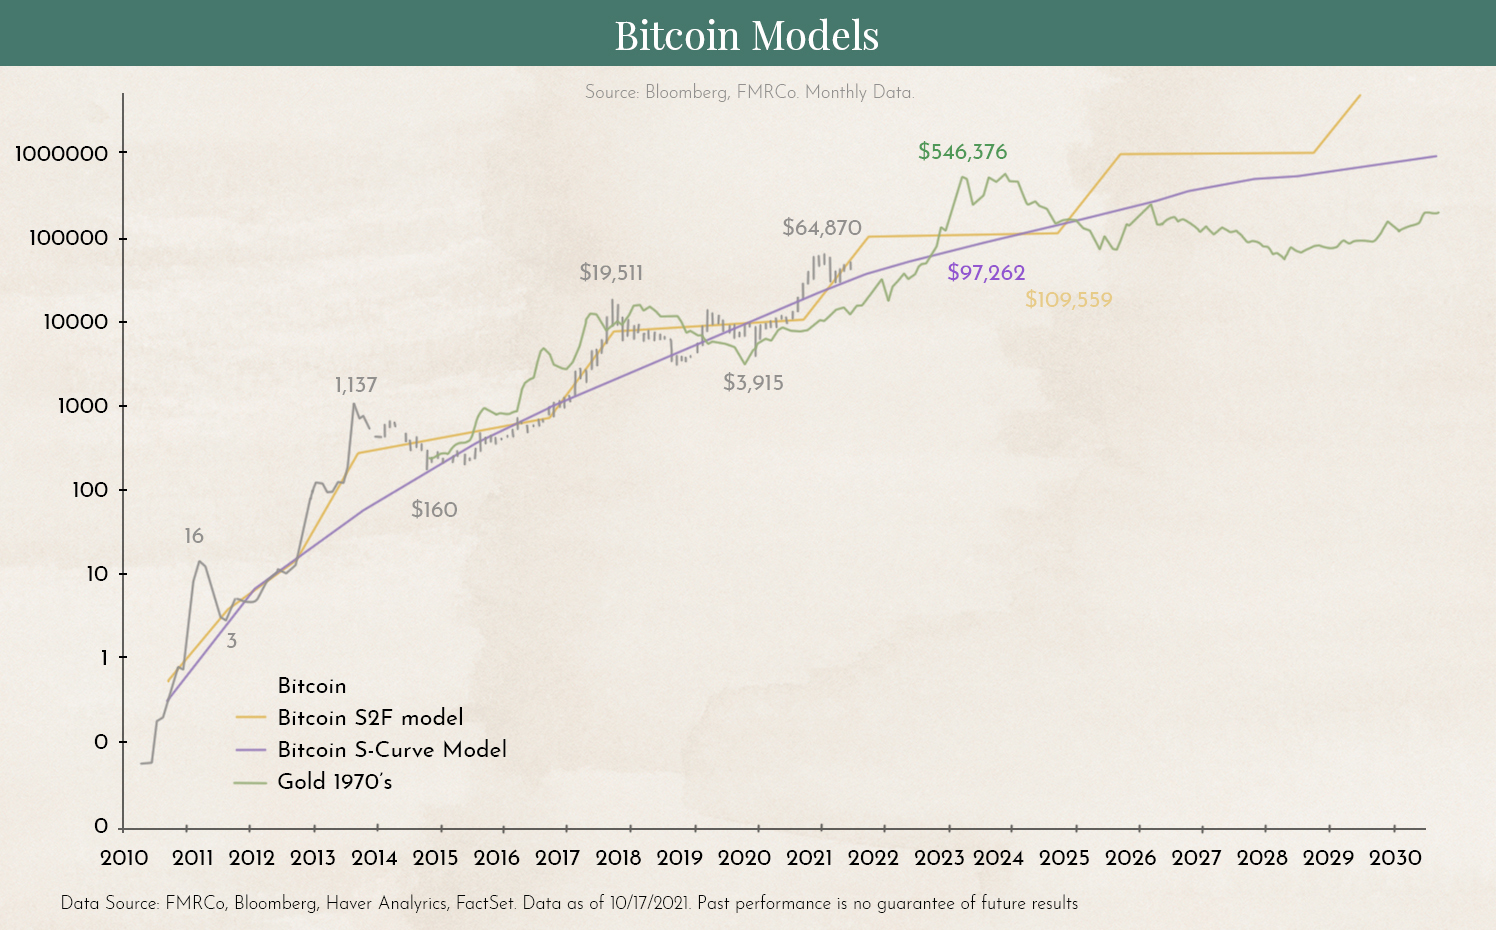
Jurrien Timmer, the respected investment director at the traditional firm Fidelity, used two models to estimate Bitcoin’s future price. His forecast: a price of $100,000 by the end of the year. That would represent a further increase of more than 60%. His models are based on events in 1970, when gold was first discovered as an asset class in wealth management.
Disclaimer:
The content in these blogs is intended solely for general information purposes and is meant to help potential clients form an impression of our approach. It does not constitute any recommendation to buy or sell assets and is not investment advice. Marmot.Finance cannot assess whether or how the statements made align with your investment objectives and risk profile. If you make investment decisions based on this blog post, you do so entirely at your own risk and responsibility. Marmot.Finance cannot be held liable for any losses that may arise from the information contained in this blog post.
The products mentioned are not recommendations; they are intended to illustrate how Marmot.Finance works and selects such products. Marmot.Finance is also completely independent and does not earn any form of compensation from product providers.


.webp)





.jpeg)




.jpeg)

.svg)


