
Chart of the Week
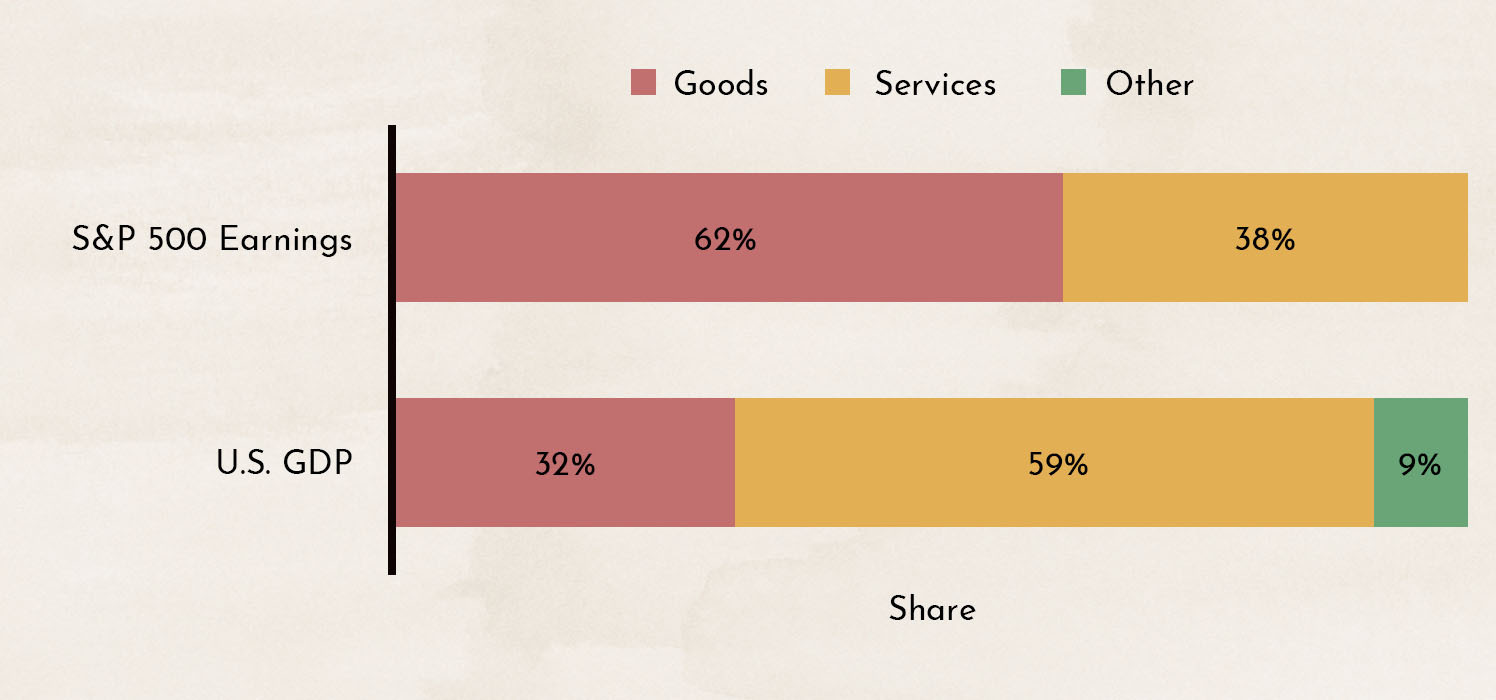
The chart shows the composition of U.S. GDP and the earnings of the S&P 500 by goods and services. It immediately becomes apparent that the two indicators are structured differently. Economic growth is primarily driven by the services sector, while the profits of the broad market index are dominated by the goods sector.
Why This Matters
When economic data is published, the media usually only mentions the overall figure (the so-called headline figure). This is where it is always important to take a closer look. Is the current economic slowdown occurring more in the goods sector or the services sector? Depending on the answer, the impact on the stock market may be greater or smaller.
The U.S. Federal Reserve Dashes All Hopes for More Gradual Interest Rate Increases
Many of the economic data releases published in recent weeks (earnings reports from restaurant chains, personal income and consumer spending, construction activity, etc.) clearly show that the economy is slowing down noticeably.

The chart shows the development of home prices (according to the Case-Shiller Index) and an indicator derived from various housing-related sub-indicators, such as new mortgage applications and construction activity. This indicator has generally shown strong predictive power. At present, it points to a significant slowdown in the housing sector and lower home prices.
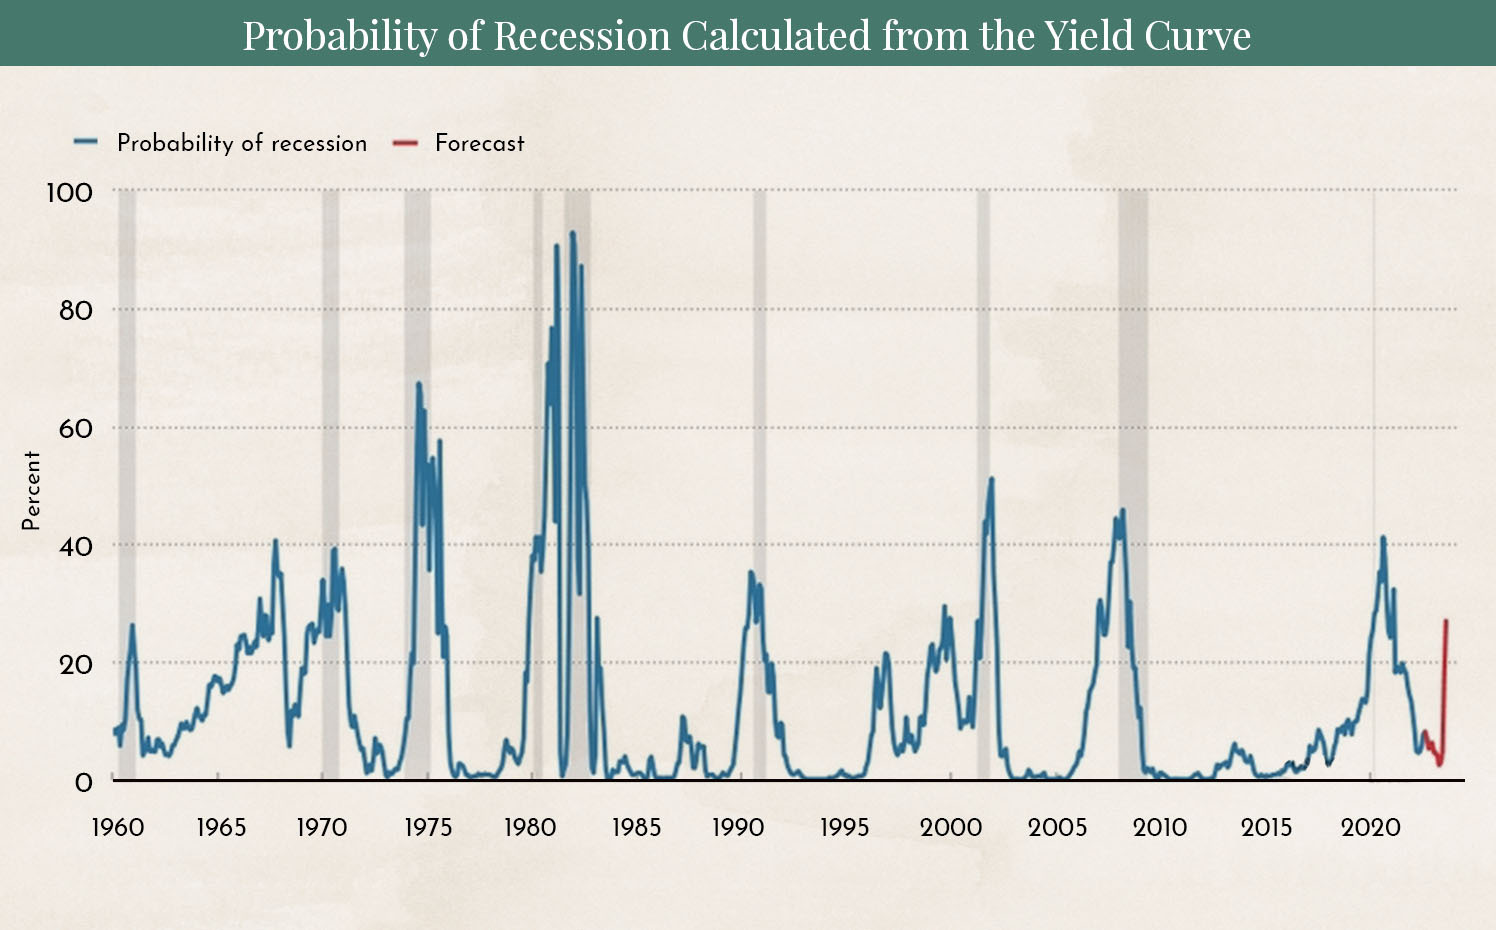
The chart shows the probability with which market participants are currently pricing in a recession. This probability can be calculated based on the shape of the yield curve. The economic data released in recent weeks, which points to a slowing economy, has increased the likelihood of a recession.
As a result, many market participants began to hope that the U.S. Federal Reserve might slow the pace of its interest rate hikes.
In a speech at the Jackson Hole symposium, where top central bankers meet every year, Jerome Powell, Chairman of the U.S. Federal Reserve, made it clear on Friday that there will be no slowdown in interest rate hikes.
Many market observers remember a similar situation in 2008, when a speech by the U.S. Federal Reserve Chair triggered a mini-crash and the stock market fell by 15%. We do not currently expect a similar scenario, but markets are highly nervous at the moment, and large daily swings are common. Right now, investors need strong nerves and a clear long-term investment strategy to avoid buying or selling at the worst-possible moment.

We have pointed out several times in our blog that, typically after the second or third interest rate hike by the U.S. Federal Reserve, a shift in market capitalization trends occurs. From that point on, small-cap stocks tend to outperform the well-known large-cap stocks. So far, however, there are no signs of this trend reversal. The large, well-known companies continue to deliver better returns or decline less than shares of smaller companies. For this reason, we have not yet made any portfolio reallocations, as we first want to see confirmation of our thesis.
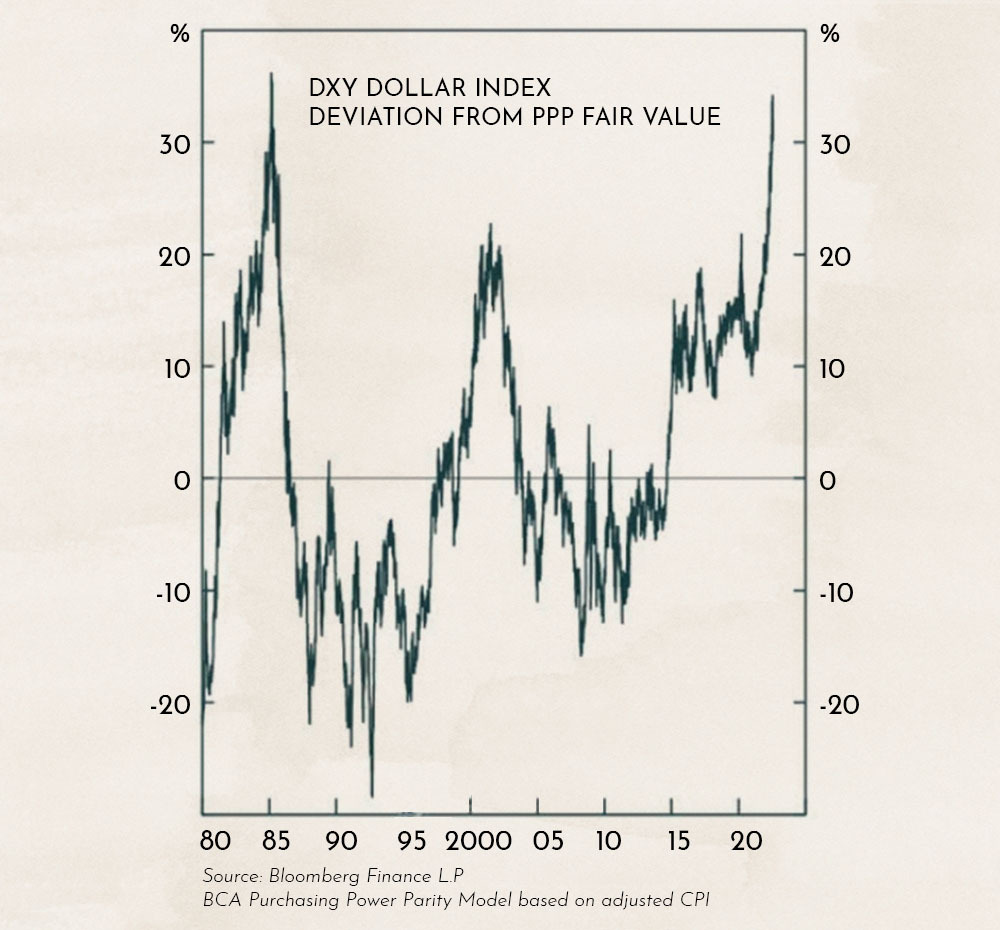
The chart shows the U.S. dollar index calculated by BCA Research and its deviation from purchasing power parity relative to fair value. The deviation is as large as it was last seen in 1980. In our previous blog article, we pointed out that most institutional investors consider the U.S. dollar to be overvalued. At present, the strength of the USD is mainly driven by the war in Ukraine and the flight to the U.S. dollar as the world’s reserve currency. The much more aggressive interest rate hikes in the U.S. compared to Europe are also contributing to this trend.
It should be noted that even the slightest sign of hope that the war in Ukraine could end soon may trigger a very strong and rapid reversal.

The chart shows the strength of countertrend rallies during bear markets (so-called bear market rallies) since 1929. The S&P 500 has recovered 53% of its decline, which represents the upper end of a typical bear market rally. We therefore view the current market correction as a normal countertrend movement rather than the beginning of a major new downturn.
Additional Image Sources: Opening graphic Designed by Freepik
Disclaimer:
The content in these blog articles is intended solely for general informational purposes and to help potential clients gain an understanding of our way of working. It does not constitute recommendations to buy or sell assets and should not be considered investment advice. Marmot.Finance cannot assess whether or how the statements made align with your investment objectives and risk profile. Anyone making investment decisions based on these blog articles does so entirely at their own responsibility and risk. Marmot.Finance cannot be held liable for any losses incurred based on information contained in this blog post. The products mentioned are not recommendations but are intended to demonstrate how Marmot.Finance works and selects such products. Furthermore, Marmot.Finance is completely independent and does not earn money in any form from product providers.


.webp)


.jpeg)


.jpeg)

.svg)