
Chart of the Week
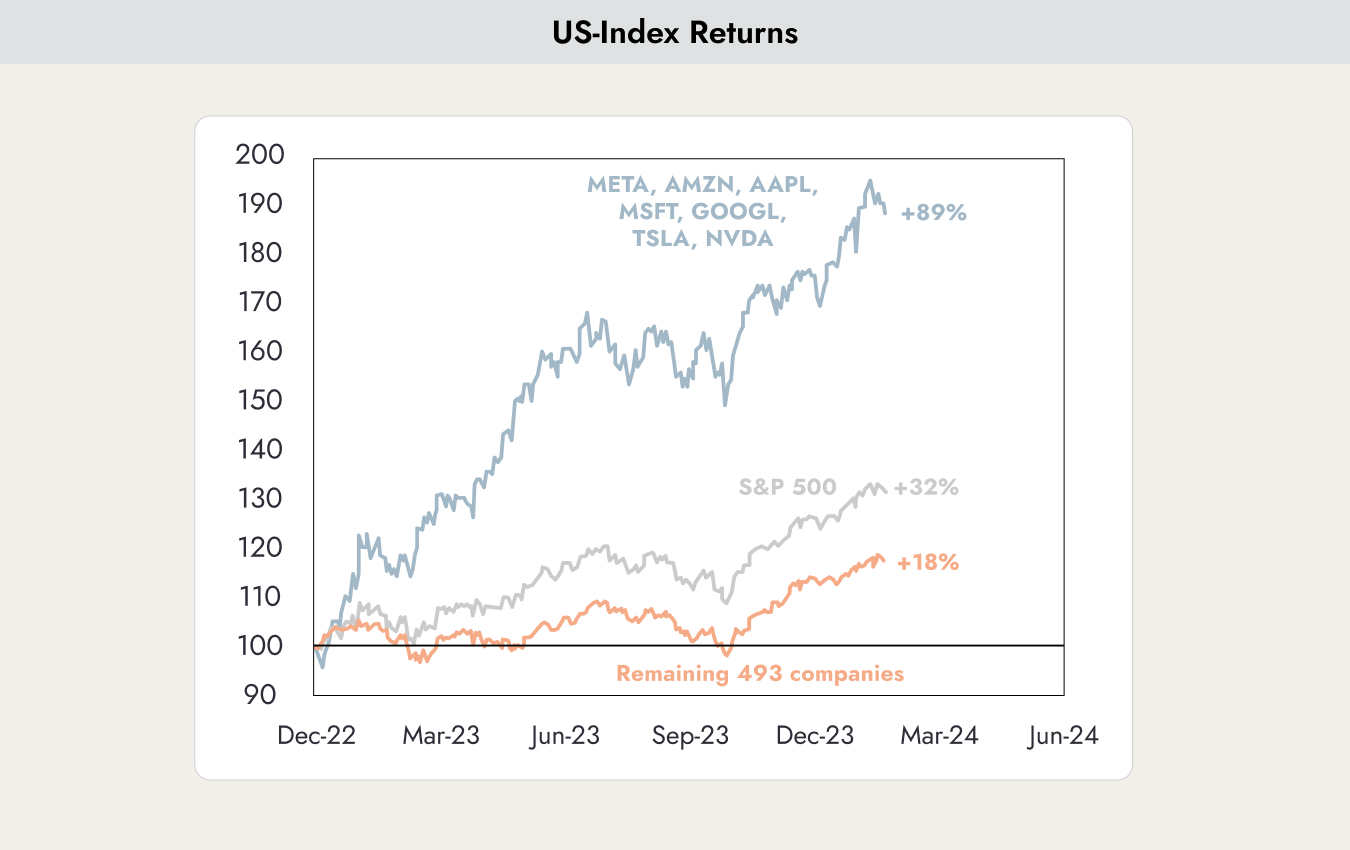
The chart shows the returns since December 2022 that an investor would have achieved by investing in the seven stocks Meta, Amazon, Apple, Microsoft, Google, Tesla, and NVIDIA (dark blue line). The grey line represents the overall market, while the light blue line shows the overall market excluding the seven companies mentioned above.
Why This Matters
In 2023, investors only achieved strong returns if they had the seven “magic” stocks mentioned above in their portfolio: the Magnificent 7.
The question is how long this can continue. That is why the publication of NVIDIA’s earnings results last week attracted such intense attention. If the artificial intelligence investment bubble bursts, it will likely first become visible in the performance of NVIDIA. The company provides the technology needed to carry out the highly complex calculations required for virtually all artificial intelligence applications.
NVIDIA not only sells the hardware required for this, but also operates its own servers, which it rents out through the cloud.
After NVIDIA had exceeded expectations by 30–40% for four consecutive quarters, many investors expected the company to disappoint and drag the entire market down with it. But once again, it managed to clearly outperform expectations. The anticipated trend reversal has been postponed — the frenzy continues.

Institutional investors normally hold well-diversified and balanced portfolios. The chart shows how heavily institutional investors have been allocated to momentum investments since 2002. This category includes growth stocks and, in particular, the Magnificent 7. Institutional investors are now more heavily weighted toward growth stocks than ever before.
This raises the question of who is still left to buy these stocks. Institutional investors are already so heavily invested that they are unlikely to add much more exposure. That leaves mainly retail investors. Normally, this signals the end of a trend.
Fear of Inflation
In a regular survey conducted by Bank of America among institutional investors, participants were asked where they see the biggest risks for 2024.
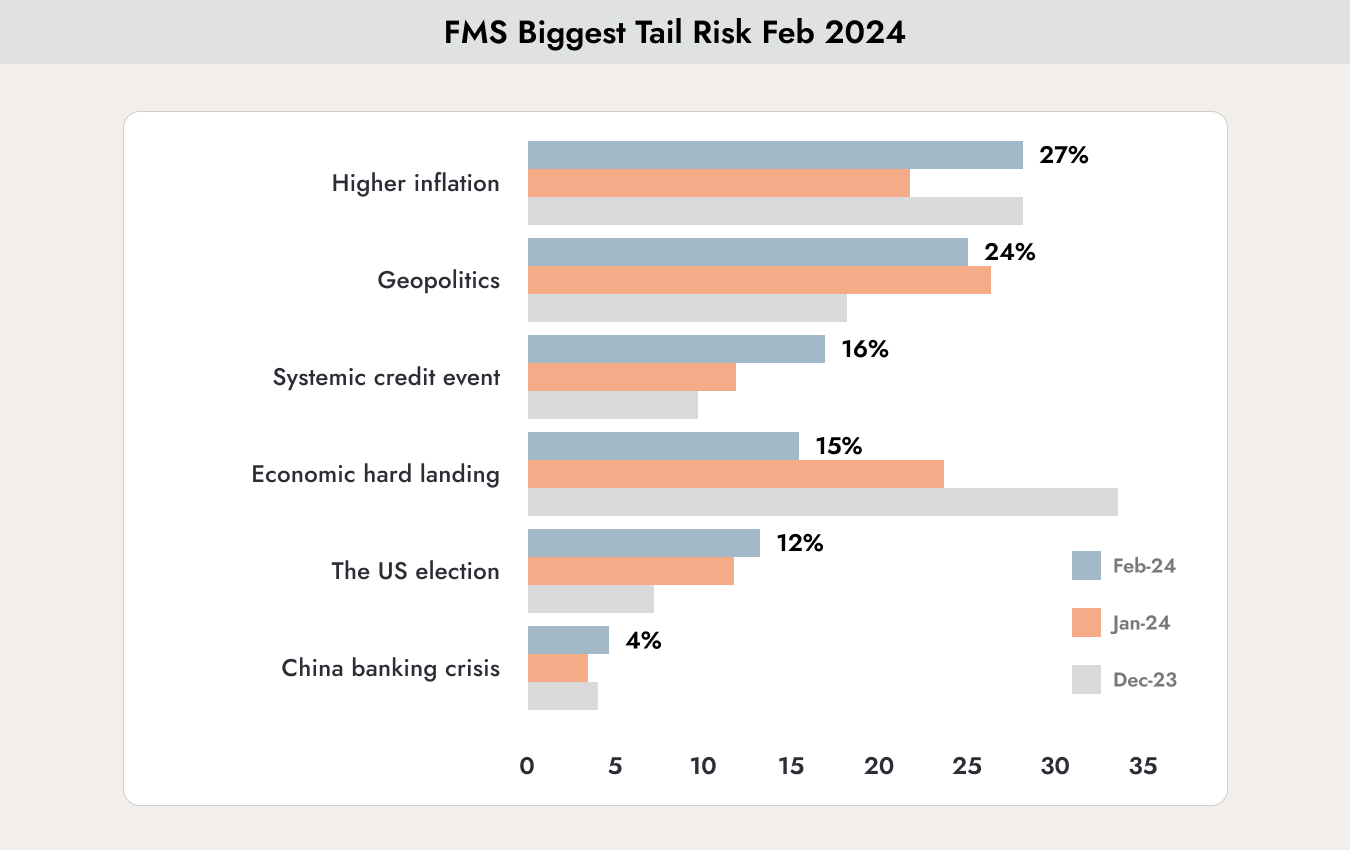
The dark blue bars represent the responses from February 2024, the light blue bars show the responses from January 2024, and the grey bars represent the responses from December 2023. Fears of a “hard landing” — meaning a severe recession — have eased. Geopolitical risks are still considered high. Topping the list of concerns is the fear of rising inflation returning. Concerns declined in January, but have now moved back to the top of the risk ranking.
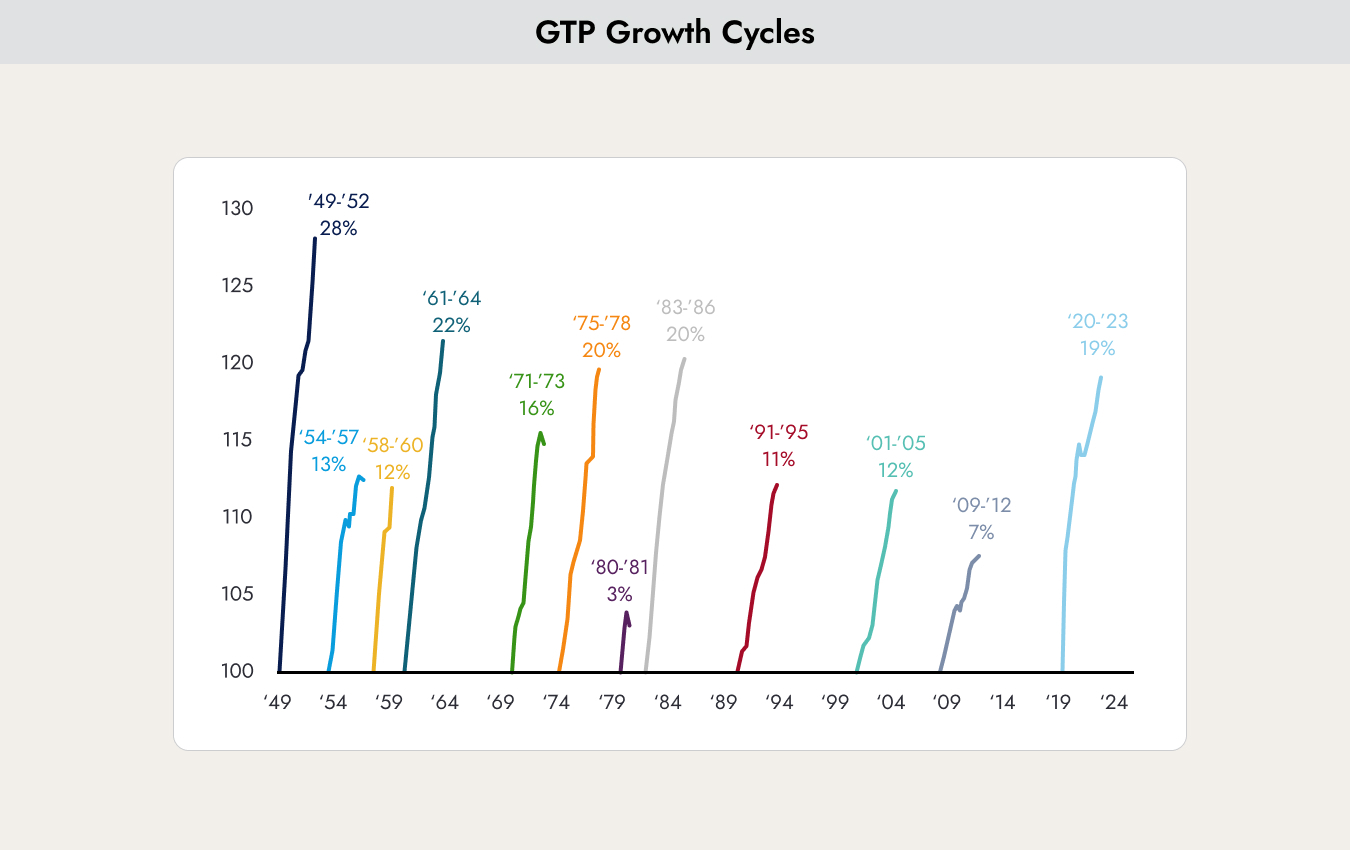
The chart shows the twelve economic growth cycles since 1950 and the increase in gross domestic product achieved during each cycle. The cycle that began after the Covid crisis has so far resulted in a 19% increase in GDP in the United States. That already represents the fifth-largest increase in history.
What is concerning, however, is that despite one of the fastest and most aggressive interest rate hiking cycles in history, economic growth is still continuing — even if at a slower pace.
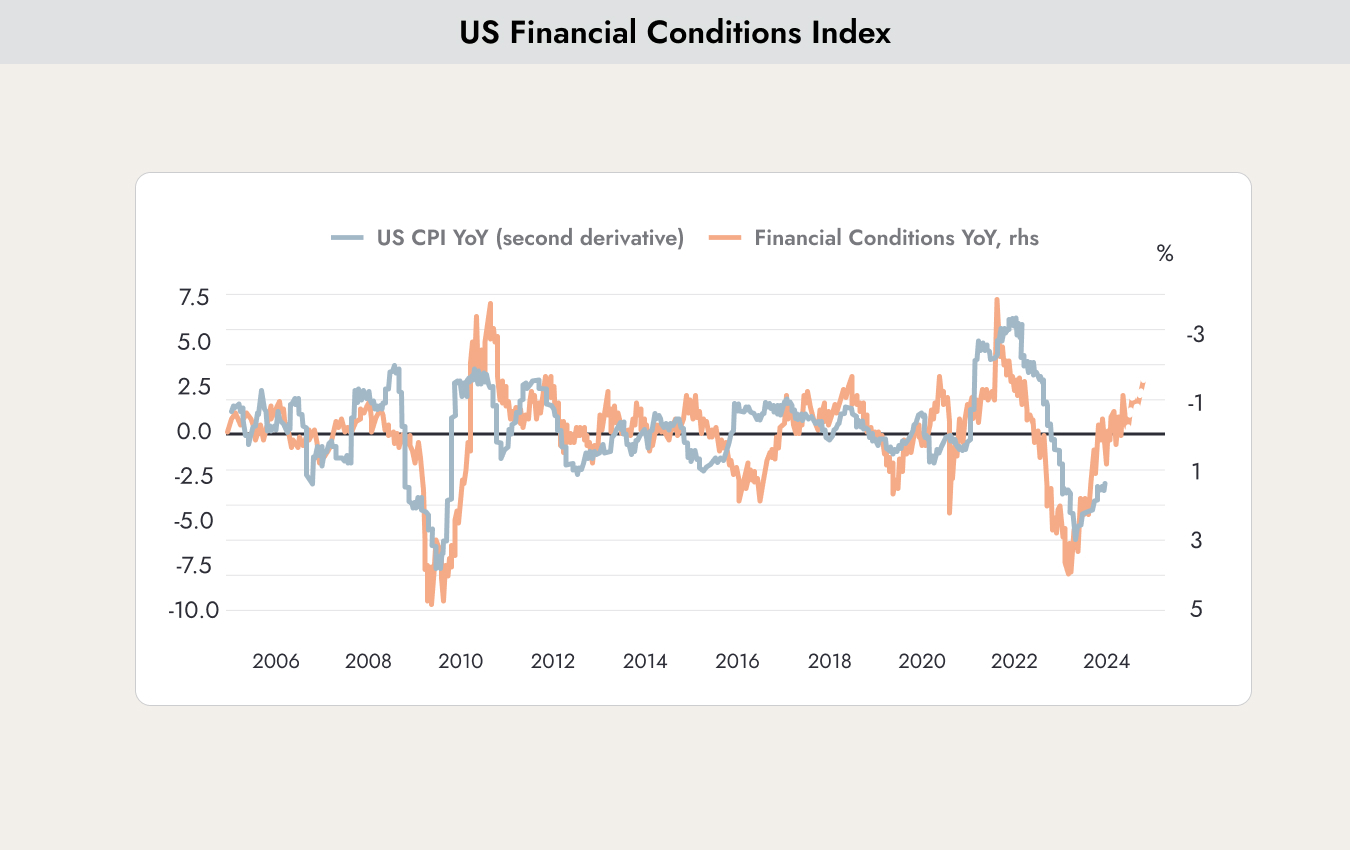
The chart shows the annual change in inflation (light blue, CPI – Consumer Price Index). Its development has a strong correlation with the Financial Conditions Index. This index indicates how easily companies can refinance themselves and take on debt. It is normally an excellent leading indicator for inflation. When companies have improved access to financing for investments, this points to continued economic growth and also to rising inflation.
The concerns of institutional investors that inflation could rise again are therefore based on real underlying factors.
In such an environment, we believe it is unlikely that the US Federal Reserve will continue cutting interest rates.
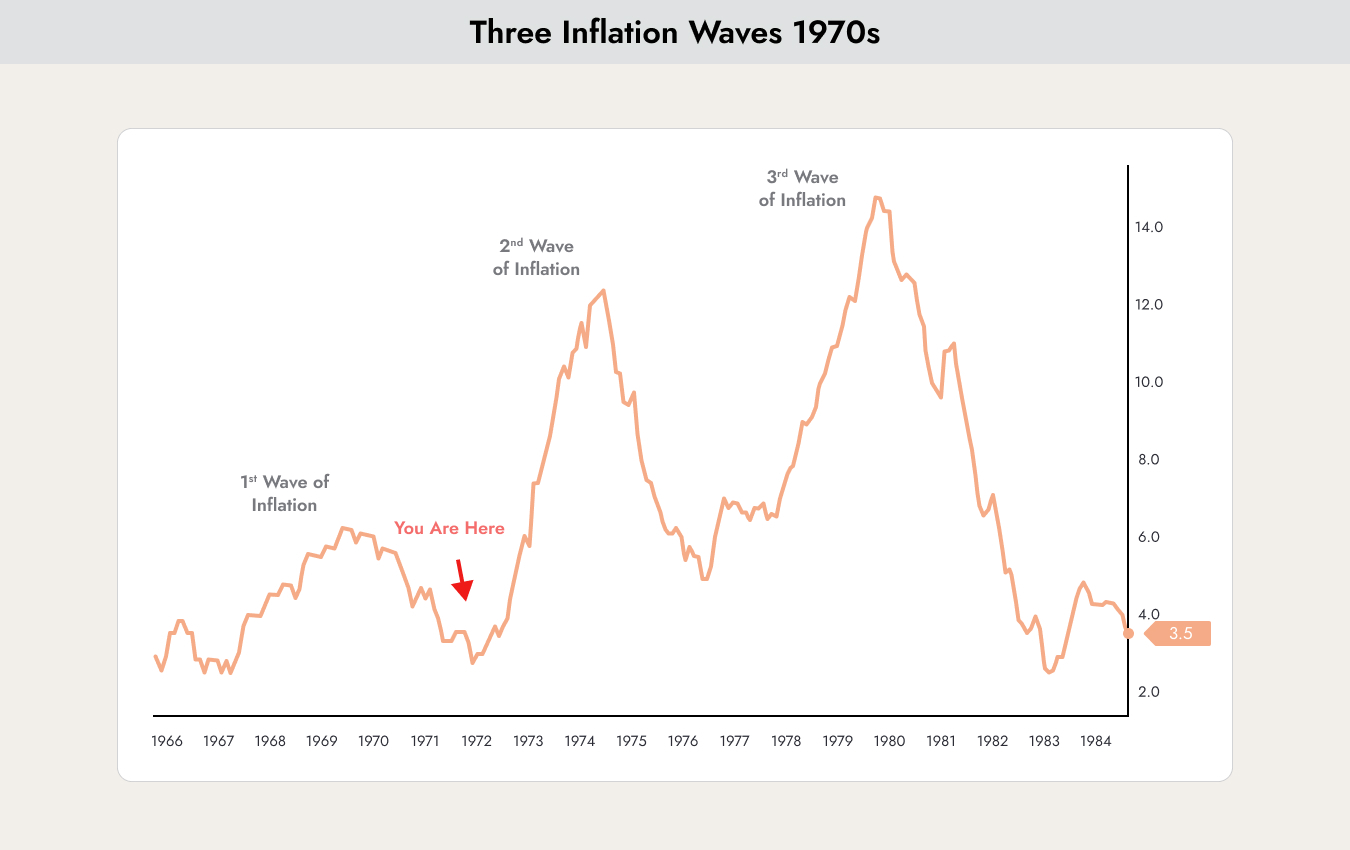
The chart shows the development of inflation from 1966 to 1984. This period is often compared to the current situation. During that time, a phase of negative real interest rates was followed by a sharp rise in inflation. When looking at the development of inflation from 2000 to today, we appear to be following the script of the 1970s almost exactly. Back then, two additional waves of inflation followed.
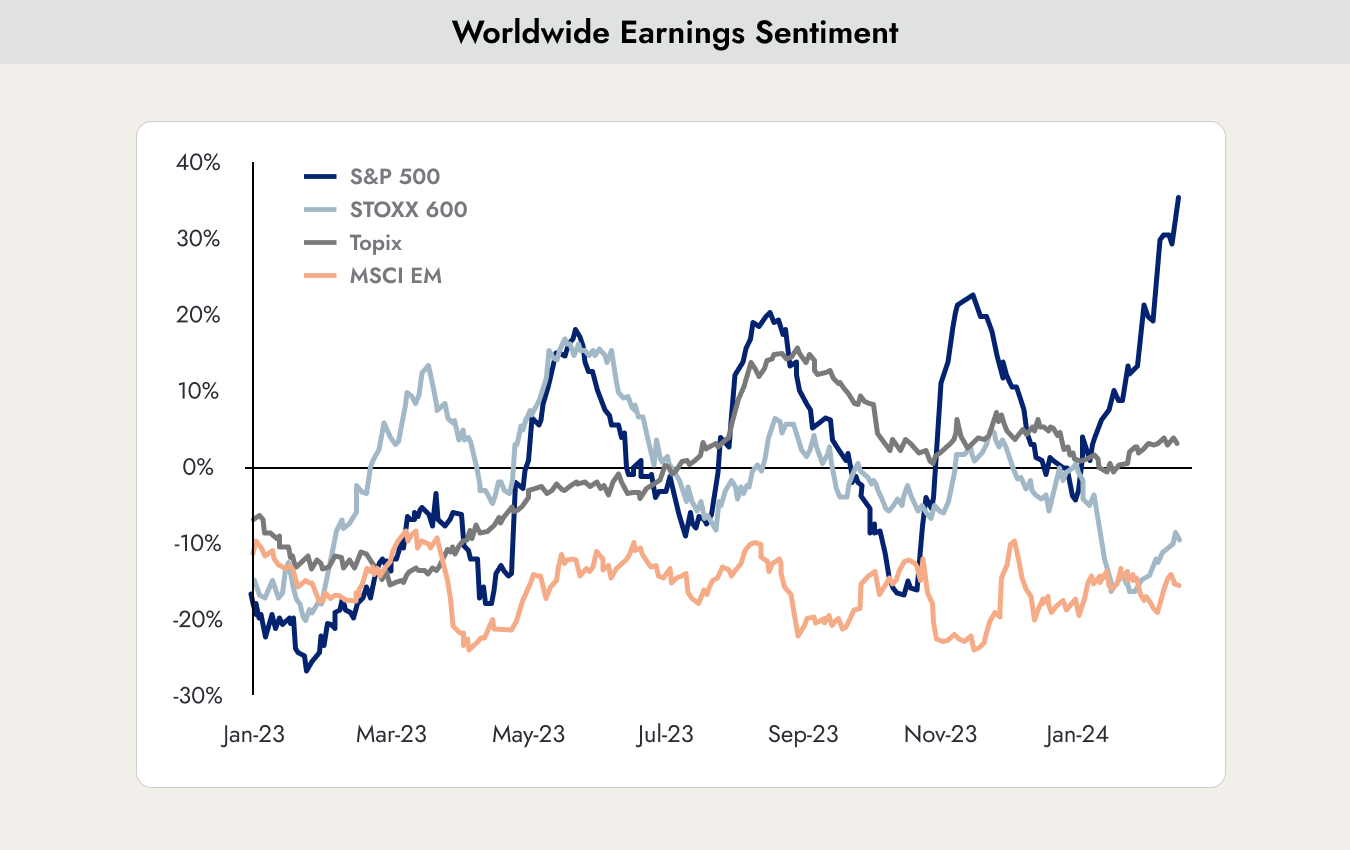
The chart shows analysts’ forecasts for corporate earnings in the United States (S&P 500), Europe (STOXX 600), Japan (Topix), and the emerging markets (MSCI EM). Corporate earnings in the United States appear to be completely decoupling from the rest of the world. This is mainly driven by the development of new technologies. Companies such as Apple, NVIDIA, and Amazon are driving technological change and benefiting from it. Nevertheless, we do not consider a divergence of the magnitude currently expected to be realistic.
Where Is the Energy Crisis?
Just two years ago, the specter of an energy crisis was everywhere. Following the outbreak of the Ukraine war, many expected a massive increase in oil and gas prices as well as severe supply shortages. Germans were urged to take shorter showers, and industry was also expected to reduce energy consumption.
So far, such a supply shortage has not materialized.

The chart shows the storage levels of gas reserves in Germany (red). Currently, they are as full as they have been at any point in the past 10 years. The dark grey line represents the average storage level over the last 10 years, while the light grey area indicates the highest and lowest levels recorded during that period.
At the moment, the situation looks very positive, and if storage levels continue to build as they have in recent years, the new legal targets of 85% capacity by the beginning of October and 95% by November should be comfortably achieved. As a result, the outlook for the winter of 2024/25 also appears favorable, even if the war in Ukraine continues.
Why did the feared supply shortage never occur? Was that much energy really saved?
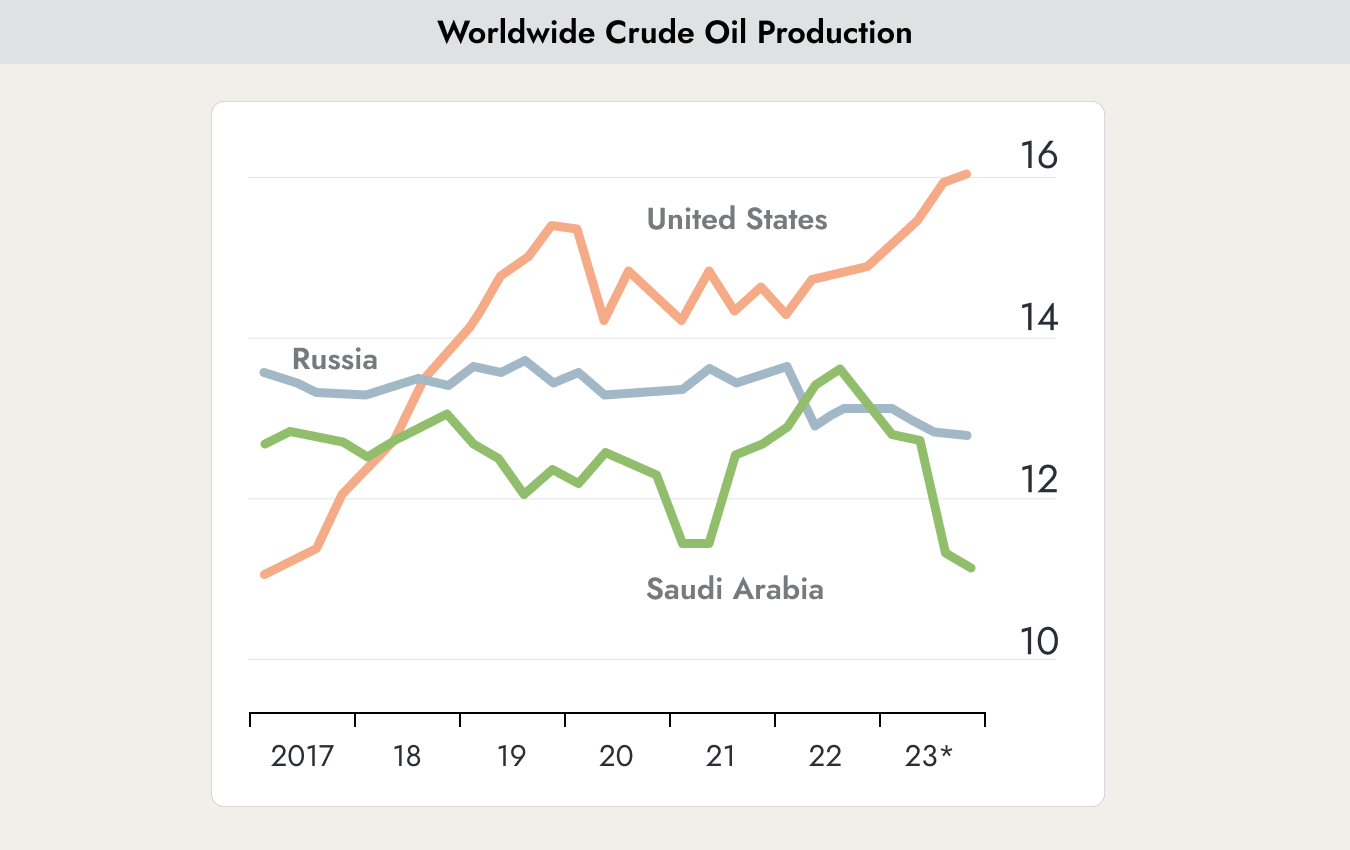
Energy was certainly saved to some extent, but the main reason lies elsewhere. The United States stepped in as a supplier. The chart shows how oil exports from the United States, Russia, and Saudi Arabia have changed in recent years. Since the fracking boom in gas production, the United States has transformed from an energy importer into an energy exporter.
The United States was able not only to offset the decline in supplies from Russia, but also the reduced output from OPEC — particularly Saudi Arabia — which sought to push oil prices higher by restricting supply. In addition to major weapons deliveries to Ukraine, the United States has also helped rescue Europe in the energy sector.
The United States has also profited significantly from this. Nevertheless, it has been a win-win situation. Without these supplies, gas and oil prices would likely be twice as high as they are today.


.webp)





.jpeg)




.jpeg)

.svg)


