
Chart of the Week

The chart shows weekly initial jobless claims in the USA. This figure indicates how many people lose their jobs each week and apply for unemployment benefits. Initial jobless claims are a reliable indicator of the US labor market. The data is published weekly by the US Department of Labor and has a significant impact on market activity.
Why this matters:
Initial jobless claims fell on Friday to their lowest level since 1969 — the lowest point in 52 years. This is a clear indicator that the US economy is recovering more strongly than expected. The downside, however, is that inflationary pressure could increase due to higher wages.
Strong economic recovery leads to rising interest rates
Despite high COVID case numbers, the US economy is recovering strongly. More and more companies are struggling to find enough qualified employees.
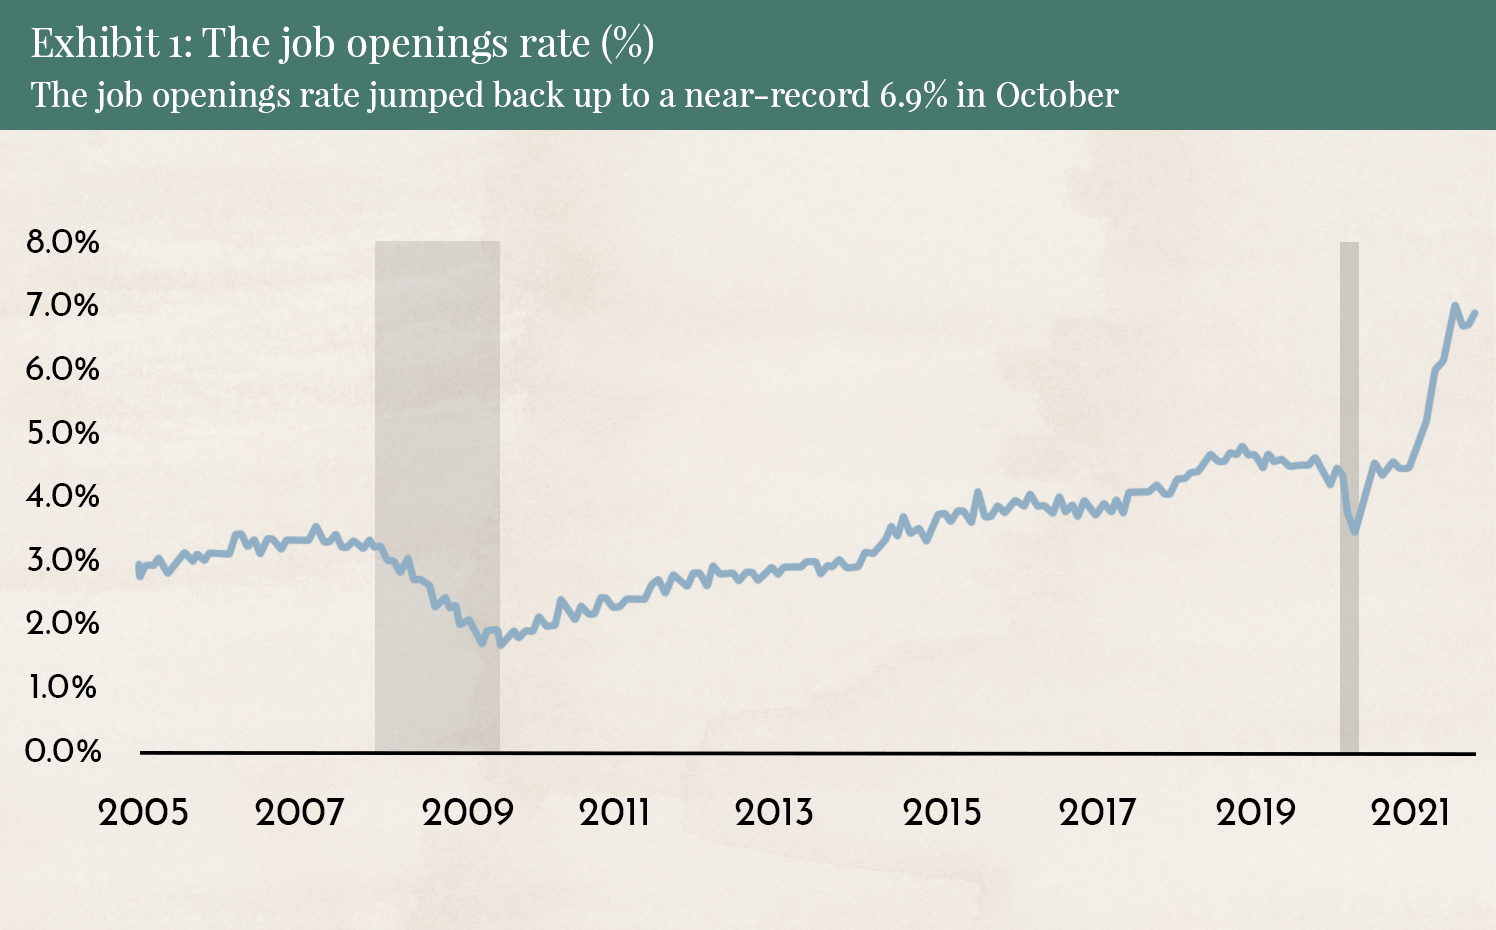
The chart shows that the number of job openings remains at a very high level. To hire enough employees, companies will be forced to raise wages. This could trigger an inflationary spiral that is difficult to stop.
As a reminder: In recent months, inflation has surged due to supply bottlenecks and the base effect from the COVID crisis. Central banks are trying to calm the markets and are using every opportunity to say that inflation is only temporarily high because of special factors and will decline significantly again in 2022.

The chart shows inflation expectations from the highly regarded investment bank Morgan Stanley and broadly reflects the expectations of the overall market. Inflation figures are still expected to remain high through January, but after that, inflation in developed markets (DM) is expected to fall back to 2%.
Low inflation would allow central banks to keep interest rates low. Contradicting expectations of low inflation in 2022, however, is the expectation among most market participants that interest rates will rise.
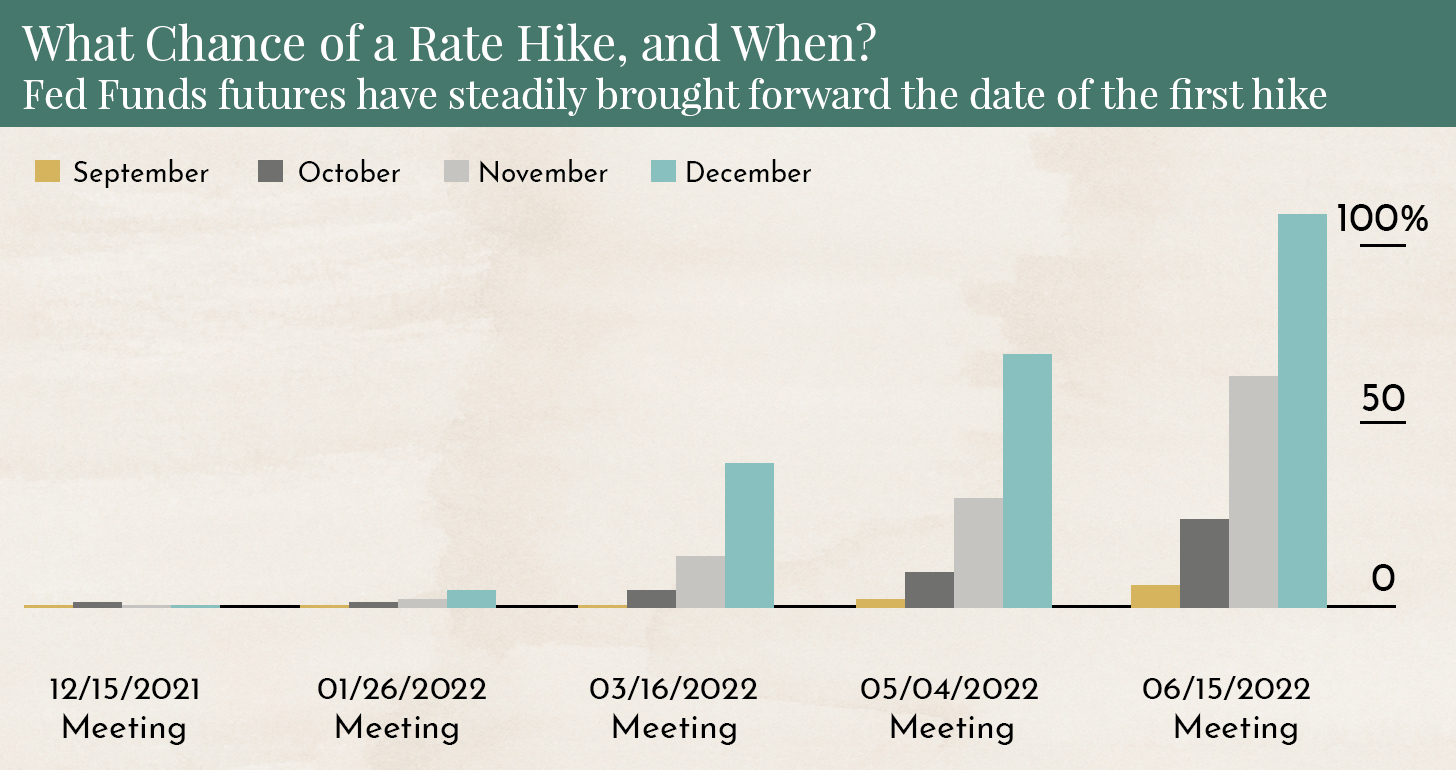
The chart shows when most market participants expect an interest rate hike in the USA and how these expectations have changed over recent months. In September 2021, only around 5% expected an interest rate hike by June 2022 — now, that figure has risen to 100%.
The US Federal Reserve is currently reducing its support for the bond market — and therefore its expansionary monetary policy — by USD 15 billion per month. By June 2022, this support will be fully phased out. Raising interest rates before then appears illogical. It would be like a driver pressing the accelerator and the brake at the same time.
Risk appetite declines
The uncertainties described above — strong economic growth, high inflation, and concerns about interest rate hikes — have led to a sharp decline in investor risk appetite in recent months.
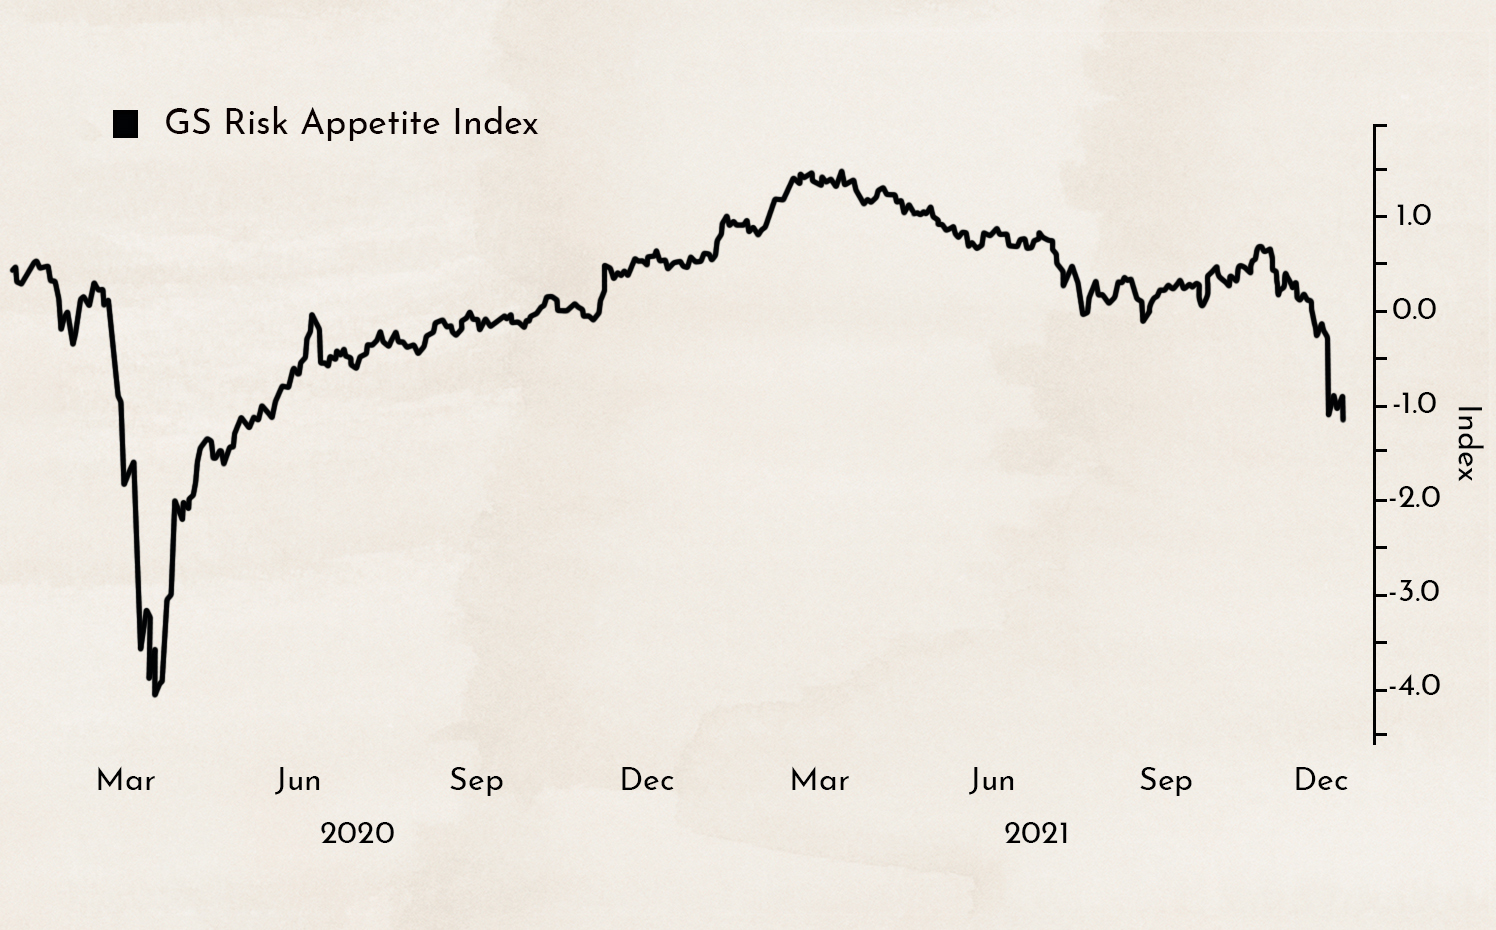
Major market indices such as the S&P 500 and the EURO STOXX 50 remain at elevated levels, but largely unnoticed by the media, significant portfolio reallocations are taking place. Investors are shifting capital into solid large companies (mega caps). Most of the money is flowing into firms with proven business models and strong earnings.

The chart shows the performance of the technology-heavy NASDAQ Index excluding its five largest holdings (Apple, Microsoft, Amazon, Tesla, and Nvidia). Although the main index has gained 20% this year, the majority of technology stocks in the NASDAQ are showing returns of -20%.
Goldman Sachs has created its own index for this, consisting of technology stocks with high market capitalizations but no profits. It includes well-known names such as Pinterest, Plug Power, Uber, Snap, Peloton, and Spotify.

These stocks were the winners of 2020, delivering returns of nearly 500%. In 2021, however, they are down more than 30%. Although the main market indices posted strong returns of 15–20% in 2021, most investors likely achieved significantly lower returns.
Disclaimer:
The content in these blogs is intended solely for general informational purposes and to help potential clients gain an understanding of how we work. It does not constitute recommendations to buy or sell assets and should not be considered investment advice. Marmot.Finance cannot assess whether or how the statements made align with your investment objectives and risk profile. If you make investment decisions based on this blog post, you do so entirely at your own risk and responsibility. Marmot.Finance cannot be held liable for any losses that may arise from the information contained in this blog post.
The products mentioned are not recommendations but are intended to demonstrate how Marmot.Finance works and selects such products. Marmot.Finance is also completely independent and does not earn any compensation from product providers in any form.


.webp)





.jpeg)




.jpeg)

.svg)


