
Chart of the Week

When announcing company results for the past quarter, corporate executives usually also provide an outlook on the challenges and concerns for the following quarter.
Why This Matters:
Corporate executives know their companies inside out, and today’s concerns will be reflected in tomorrow’s earnings results. This compilation therefore has very strong predictive value. Currently, executives are most concerned about finding enough qualified employees, supply chains and delivery disruptions, and weakening demand. Compared to the previous quarter, new concerns have also emerged about whether companies have sufficient pricing power to raise prices and about the creditworthiness of customers.
These concerns point to weaker earnings results for the fourth quarter compared to the third quarter, as well as a continued inflationary environment driven by rising wages and supply chain challenges.
Earnings Season Successfully Concluded

The chart shows how many companies in the S&P 500 Index exceeded earnings expectations (blue), how many met expectations (black), and how many fell short of expectations (red). At first glance, the figures look impressive. More than 80% exceeded expectations, while only 13% disappointed. On closer inspection, however, the slowing momentum among companies beating expectations becomes apparent, as does the fact that the number of companies failing to meet expectations has nearly doubled.
.jpeg)
Since 2019, the technology sector has been the main driver of positive surprises during earnings announcements. As in the second quarter, however, the technology sector was unable to maintain this leadership position. To us, this is a sign that the technology sector is being valued more realistically. In some cases, extreme overvaluations are beginning to unwind. At present, investors are therefore better positioned in solid value stocks.
.jpeg)
Regular readers of this blog will already be familiar with this chart. It shows earnings forecasts for the past 10 years (all data to the left of the zero line) and the actual reported results (to the right of the zero line). In the third quarter, average earnings growth of 28% was expected, but 32% was delivered. In the second quarter, 64% was expected and 96% was delivered. For the fourth quarter of 2021 (blue line), growth of +20% is currently expected. Based on the concern barometer discussed in the “Chart of the Week” section, we do not believe this forecast will improve significantly by year-end, and there is even a risk that more companies may disappoint in the fourth quarter.
No Surprises from Central Banks
On Wednesday, the U.S. central bank delivered exactly what was expected. Monthly bond purchases of USD 120 billion will be reduced by USD 15 billion per month. This officially marks the beginning of tapering and the exit from an expansionary monetary policy. However, the U.S. central bank made it clear that there is no urgency and that policy changes will be implemented very gradually. The Bank of England and Bank of Japan made similar announcements on the same day. Central banks continue to pursue an expansionary monetary policy to support the economy and equity markets, although somewhat less aggressively than in recent months. This is likely to have a positive impact on equity markets over the coming months.
Comparison of the Economic Recovery with Cycles of the Last 150 Years
Following the sharp economic downturn after the outbreak of the COVID pandemic, the economy has recovered strongly since April 2020. Since 1870, there have been 30 such expansion phases following a recession. How does the current recovery compare to previous expansion phases over the last 150 years, and what conclusions can be drawn from it?
.jpeg)
Rising inflation is causing concern among many market participants — including us. However, the chart shows that, in terms of inflation, we are broadly in line with previous recovery periods. What the chart does not show, however, is that unlike past cycles, we are still dealing with an ongoing pandemic that continues to disrupt global supply chains.
.jpeg)
Compared to previous expansion cycles, the S&P 500 has already risen very strongly. Slower growth in the S&P 500 or a modest correction would therefore not come as a surprise. Central banks could, of course, soften or even prevent such a correction through continued expansionary monetary policy.
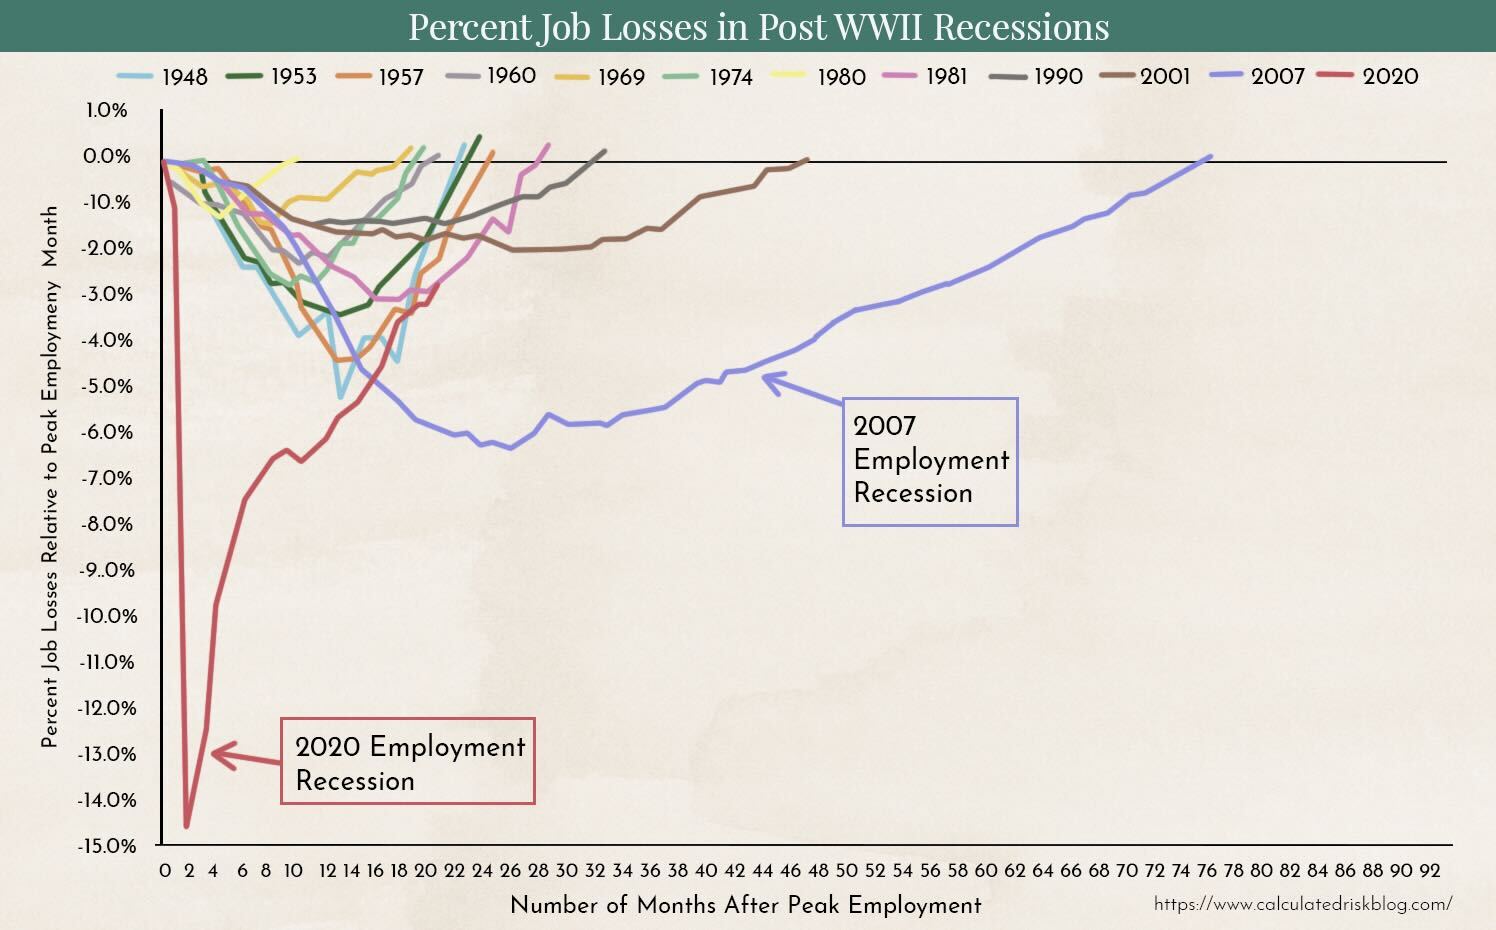
U.S. unemployment clearly highlights how different the current development has been compared to previous expansion phases. The recovery here is likely to continue at a rapid pace. As positive as this trend is for anyone in the U.S. looking for a job, it may prove problematic for wage inflation. At the moment, this represents the greatest risk of a more significant stock market correction.
Bitcoin Seasonality and the Gold Model
Since the launch of the first futures ETF on Bitcoin, interest in cryptocurrencies among major banks and asset managers has increased significantly. One of the analyses currently being most widely shared and discussed in the crypto space is the work of Jurrien Timmer. He is the Chief Investment Officer (CIO) of the traditional asset manager Fidelity Investments.
.jpeg)
Jurrien Timmer compares the price development of Bitcoin with that of gold from 1970 to 1980. It was only in 1970 that the investment market began to embrace gold, and the first investment products were launched to integrate gold into end-client portfolios. This mirrors the process currently taking place with Bitcoin. Back in 1970, gold prices were also more volatile, and only a few banks had incorporated gold into their investment strategies. Today, this is standard practice for virtually every bank.
The similarity between the charts is striking — and the forecast even more so. A rise to 100,000, meaning more than 66% upside within the year, and a move to 200,000 in 2022, representing an increase of 230% from current levels.
Also interesting in this context is the seasonality of Bitcoin.
.jpeg)
The chart shows the average annual performance of Bitcoin over the past 10 years. Historically, the best time of year to invest in Bitcoin has been from May to September and from November through the end of the year. Has the typical Christmas rally in Bitcoin just begun?
Disclaimer:
The content in these blogs is intended solely for general information purposes and to help potential clients gain an understanding of how we work. It does not constitute recommendations to buy or sell assets and should not be considered investment advice. Marmot.Finance cannot assess whether or how the statements made align with your investment objectives and risk profile. If you make investment decisions based on this blog post, you do so entirely at your own risk and responsibility. Marmot.Finance cannot be held liable for any losses that may arise from the information contained in this blog post.
The products mentioned are not recommendations but are intended to demonstrate how Marmot.Finance works and selects such products. Marmot.Finance is also completely independent and does not earn any compensation from product providers in any form.


.webp)





.jpeg)




.jpeg)

.svg)


