
Chart of the Week

The chart shows the performance of the broad U.S. stock market index, the S&P 500, compared to the performance of the most popular retail stocks (Amazon, Apple, Netflix, Tesla).
Why This Matters
In 2021, the headlines were “Invest in the best stocks of the century now.” Those who joined the trend too late and allowed themselves to be overly influenced by such headlines have now suffered significant losses. A solid analysis and broad portfolio diversification are more important than being guided by trends in the media.
What could be the next bubbles to burst? A frequently mentioned favorite is the real estate sector. The fastest rise in interest rates since 1950 may leave its mark. But those still buying gas and oil stocks now may also be taking a significant risk.
Higher Energy Prices Are Influencing the Markets
The stock markets had a strong start to the week but were later slowed down by rising oil prices. The “light” oil embargo approved by the EU has pushed oil prices even higher.
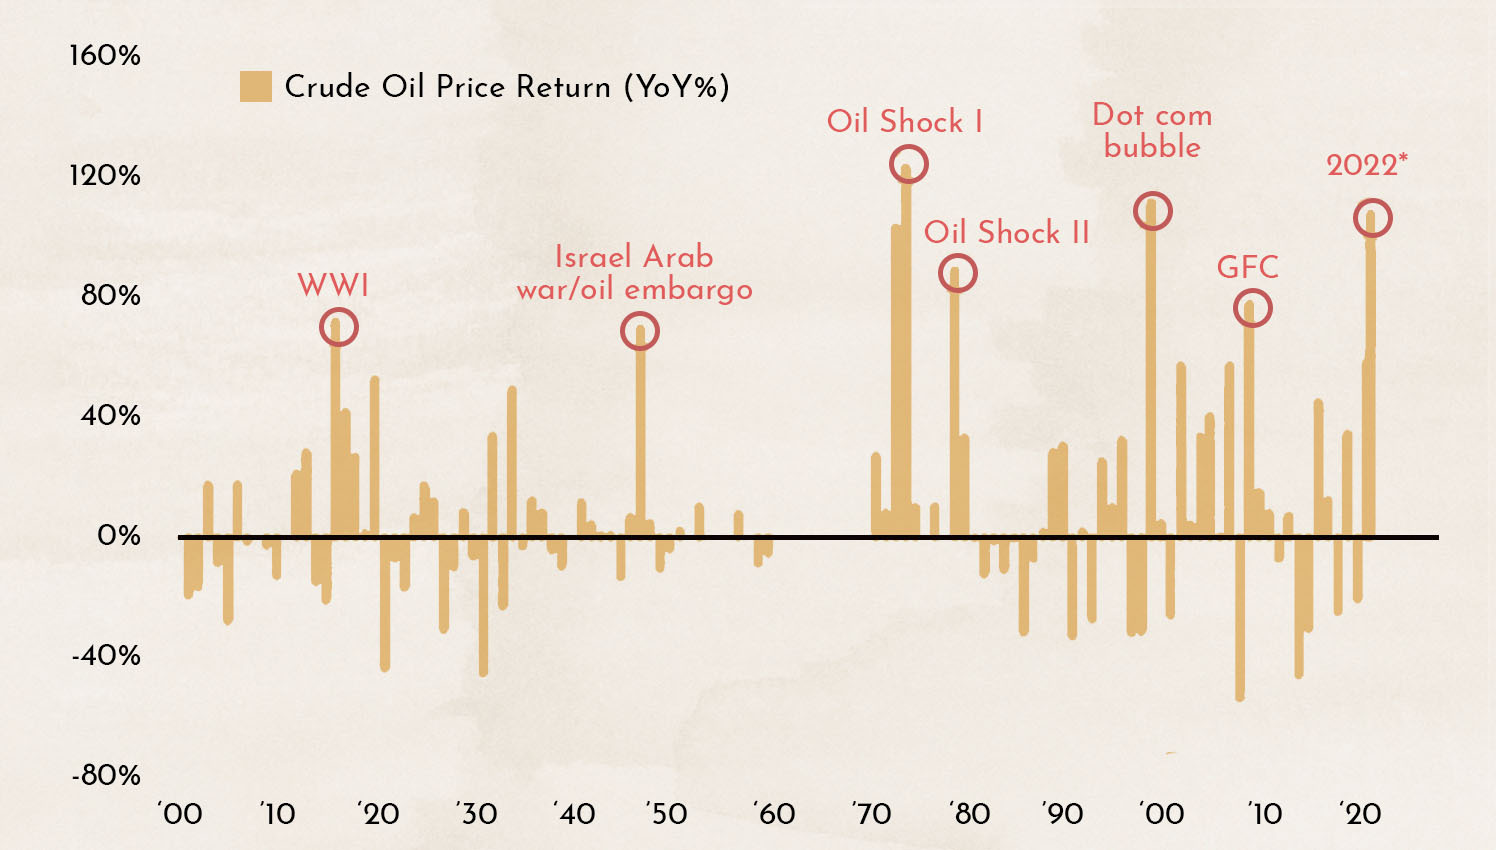
The chart shows the highest annual changes in crude oil prices since 1900. The current increase is the third-highest ever recorded. Only in 1974 and 1999 was the increase greater.
.png)
The chart shows that an oil price above USD 110 increases the probability of a recession in the U.S. to over 50%.
The path to a rise in the stock markets is therefore currently almost entirely in the hands of oil prices and, consequently, the development of the war in Ukraine.
First Signs of Slowing Inflation Momentum
Last week, the publication of inflation figures above 7% in the EU shocked many consumers and investors. However, higher inflation had long been expected by the stock market, so the release of the figures was not a major surprise.
If you look very closely at the inflation figures, there are even increasing signs of slowing momentum.

The money supply has a major influence on inflation. The chart shows the M2 money supply (cash in circulation plus demand deposits held by non-banks at credit institutions, plus savings deposits). The normalization of supply chains, combined with the reduction of central bank money supply, should lead to lower inflation. This is an early indication that inflation could decline again in the coming months.

The chart shows an unusual discrepancy between inflation (CPI, Consumer Price Inflation) and consumer spending (PCE, Personal Consumption Expenditures Price Index). The PCE indicates how significantly consumers in the U.S. have reduced their spending in recent months. While this is raising recession fears among some commentators, it could first lead to easing inflation.
A small jab at one of this week’s top headlines: “Elon Musk wants to lay off 10% of the workforce because he has a bad feeling about the economy.” If Elon Musk read this blog, he could rely on facts instead of arguing based on his feelings.
The two indicators give hope that we are not heading into a phase of hyperinflation. However, one of the biggest influences on inflation remains energy prices. Only if they stop rising further will inflation begin to decline as well.
Anyone who wants to know how the stock market is performing right now should therefore first look at the oil price.
Western governments still have room to generate positive news on this front. An agreement with Iran or Venezuela to lift sanctions on these countries, or the further release of strategic oil reserves, would have a very positive impact on the stock market. A genuine increase in oil supply by OPEC would also help.
Disclaimer:
The content in these blogs is intended solely for general informational purposes and to help potential clients gain an understanding of how we work. It does not constitute recommendations to buy or sell assets and should not be considered investment advice. Marmot.Finance cannot assess whether or how the statements made align with your investment objectives and risk profile. If you make investment decisions based on this blog post, you do so entirely at your own risk and responsibility. Marmot.Finance cannot be held liable for any losses that may arise from the information contained in this blog post. The products mentioned are not recommendations but are intended to demonstrate how Marmot.Finance works and selects such products. Marmot.Finance is also completely independent and does not earn any compensation from product providers in any form.


.webp)





.jpeg)




.jpeg)

.svg)


