
Chart of the Week

The chart shows the market capitalization of all Chinese stocks (red) and the market capitalization of Microsoft, Apple, and NVIDIA.
Why this matters
The chart illustrates, with another example, how absurdly overvalued the three stocks of Microsoft, Apple, and NVIDIA are. Since last week, the combined market capitalization of these three companies has been higher than the valuation of the entire Chinese market.
We have been talking about these absurdly high valuations for a long time. Nevertheless, the market continues to push higher, driven by the artificial intelligence narrative.

The chart shows the performance of the U.S. stock market (S&P 500, dark blue). In light blue, it shows the performance excluding NVIDIA, and in red, it shows the index excluding the Magnificent 7.
Anyone who did not hold NVIDIA or any of the Magnificent 7 stocks in their portfolio had to accept an underperformance of nearly 10% in 2024 compared to the broader benchmark.
After many investors (including us) had invested in value stocks in the face of a looming recession, they were not rewarded.

In 2024, the outperformance of growth stocks accelerated once again.
Interest rates are falling in Europe, but not in the U.S.
In Europe, the European Central Bank (ECB) cut interest rates for the first time since 2019. At the same time, economic data released in the U.S. has made an interest rate cut appear unlikely.
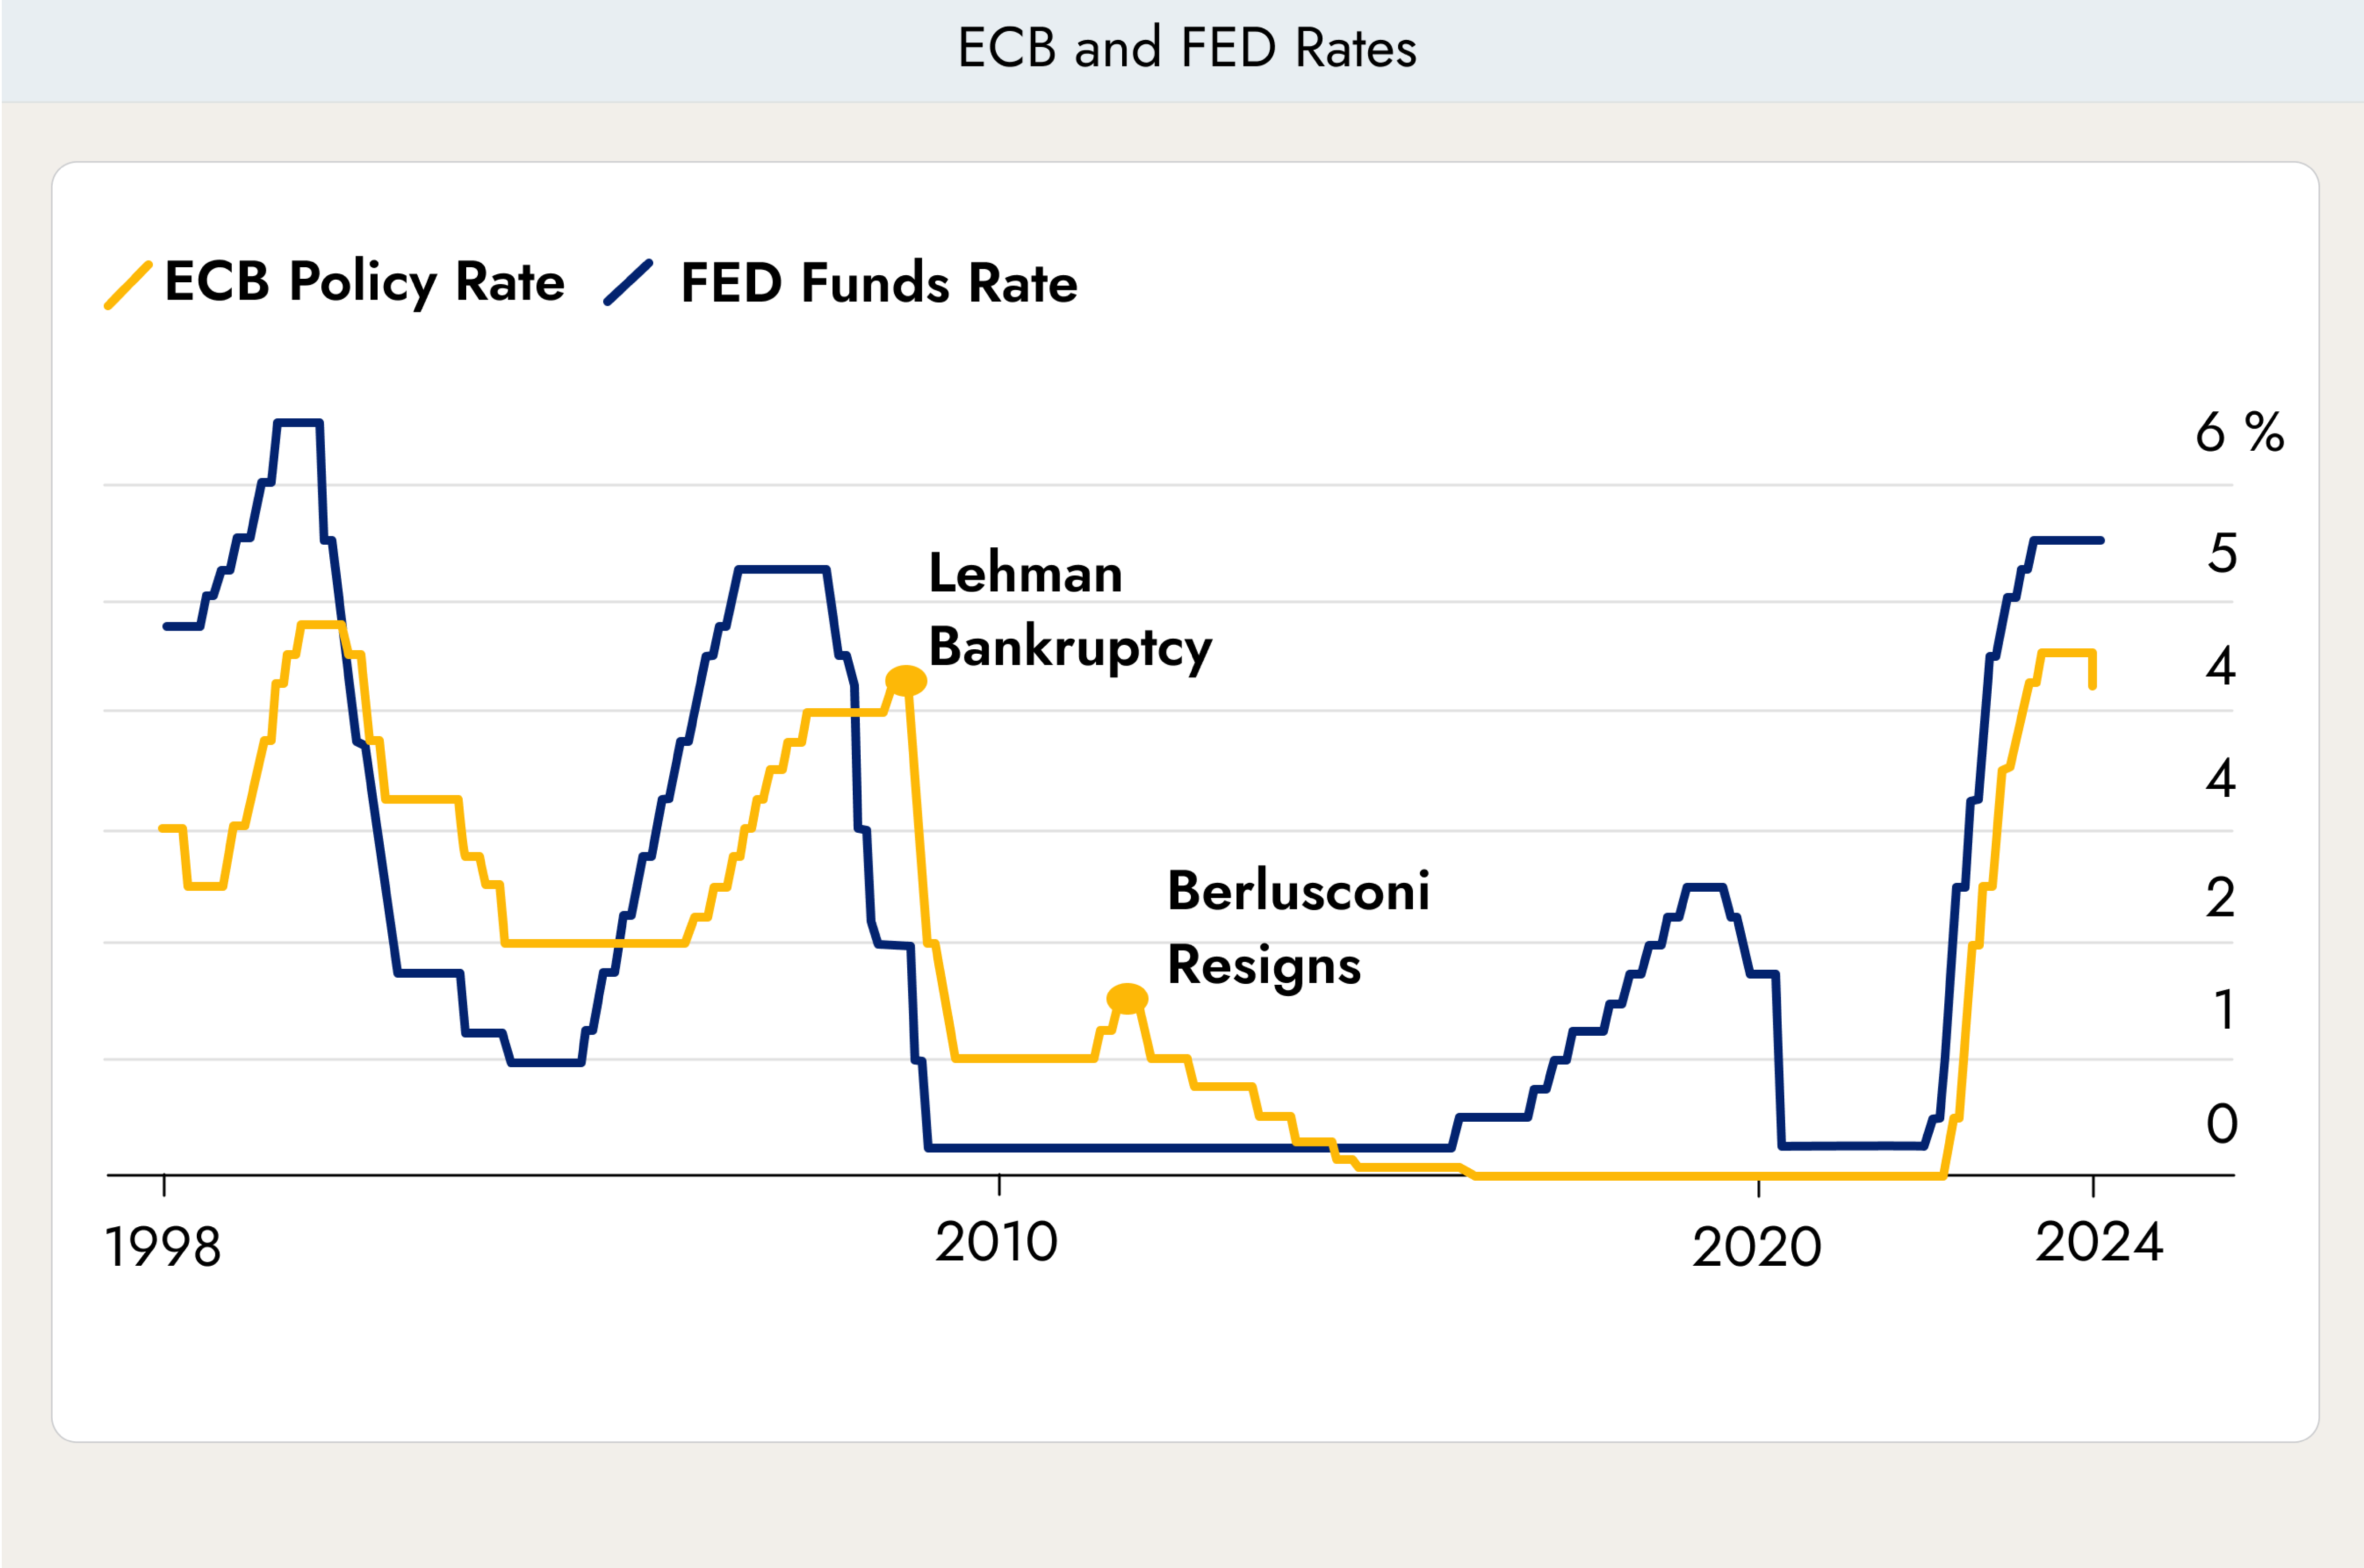
- Low interest rates are good for the economy. Borrowing becomes cheaper, and companies can finance projects that were not viable under higher interest rates. Corporate margins improve, and company growth becomes easier. If interpreted this way, the stock market should rise.
- Growth in Europe was weak, but there were no clear signs of a recession. Central banks intervene when inflation is too high or when there is a risk of recession. The ECB has now made it clear that it believes a recession is looming unless interest rates are cut. This means the European economy is in much worse shape than many people think. If interpreted this way, the stock market should fall.

The chart shows a forecast from Oxford Economics, representative of many others. Most expected the European economy to recover slightly even without an interest rate cut.
he ECB’s primary mandate is to maintain price stability by targeting a 2% inflation rate over the medium term. This made the June rate cut controversial, as the ECB simultaneously raised its staff inflation projections for both 2024 and 2025.
So far, neither of the reactions described above has occurred. After the announcement of the decision, the stock market initially rose by 0.5% and then fell by 1%. Investors have therefore not yet clearly chosen one side or the other.
One aspect still needs to be considered: government debt. High interest rates do not only affect companies, but also governments. Lower financing costs provide relief, particularly for highly indebted countries such as Italy, Portugal, and France. Another euro crisis is therefore likely to become less probable.

The chart shows the seasonal accumulation of nonfarm payrolls in the U.S. over the course of the calendar year. The dark blue line represents the 20-year average trend, while the green and red lines track the cumulative progress of 2023 and 2024 respectively. On the other hand, unemployment has risen slightly, which is somewhat confusing.
The fact that the unemployment rate increased while the economy created so many new jobs may seem impossible. However, the monthly employment figures and the unemployment rate are derived from two different surveys, and it can happen that they sometimes send conflicting signals.
Some economists are convinced that the surprisingly strong gains in employment may be partly due to high levels of immigration, which have increased the number of job seekers. This could lead to growth in the labor force without creating stronger competition for workers.
However, the unemployment rate is based on a smaller survey and can fluctuate from month to month. As a result, investors initially focused on the employment and wage figures on Friday, leading many to scale back their bets on an interest rate cut by the Federal Reserve this year.

The chart shows the annual change in newly created full-time jobs in the U.S. Even though many new jobs have been created, it is clearly visible that the economy is generating more part-time jobs than full-time positions. This is generally not a very good sign.


.webp)





.jpeg)




.jpeg)

.svg)


