
Chart of the Week
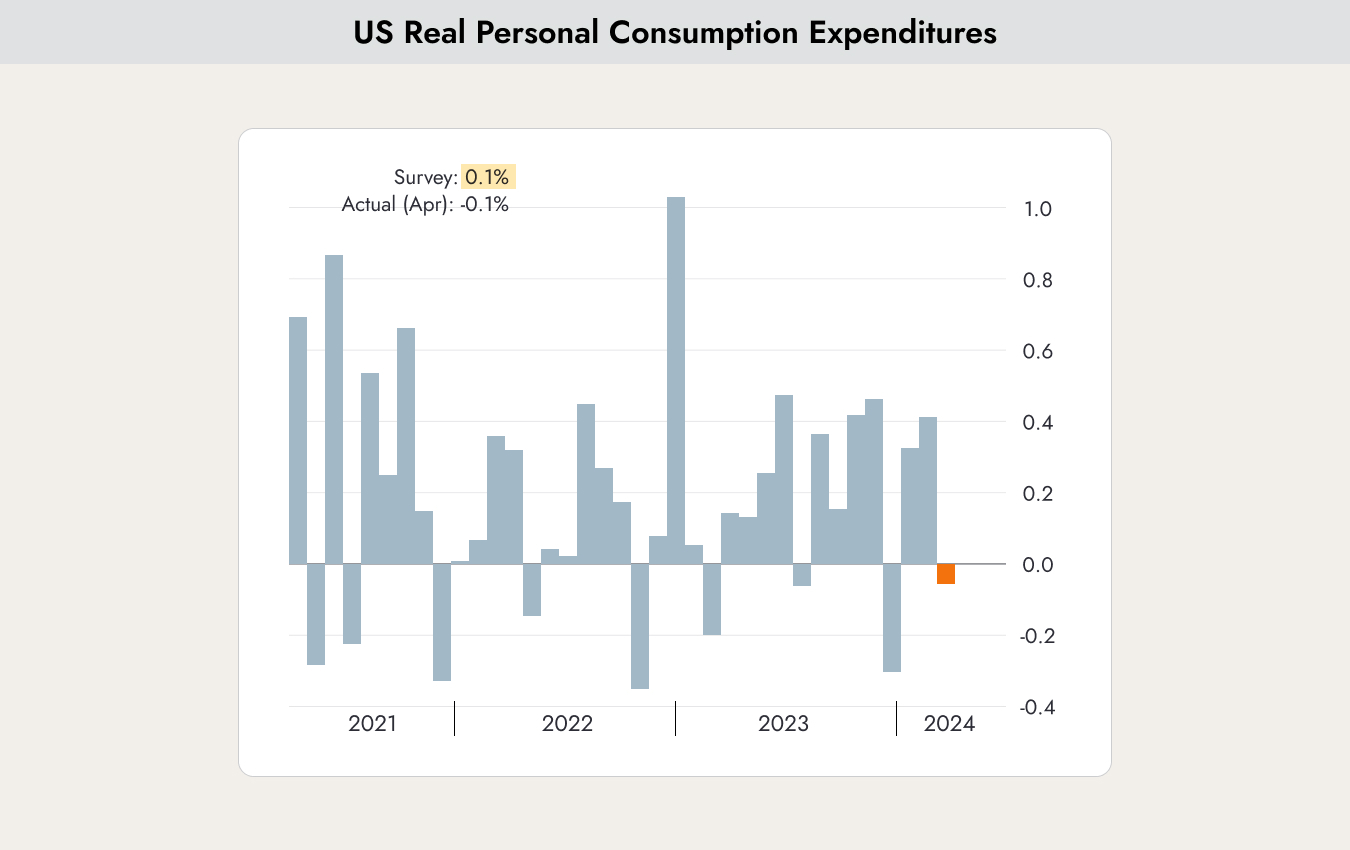
The chart shows the monthly change in US consumer spending. An increase of 0.1% was expected for April, but last week a decline of 0.1% was reported instead.
At the same time, core PCE inflation figures for April were published at the end of May, showing that price pressures are stabilizing but remain sticky.
Why this matters
The mixed picture continues, just as in previous months. Positive and negative economic data are balancing each other out. The continued decline in inflation is excellent news, but the drop in consumer spending is a negative sign.
In market phases like these, it is important to have a long-term plan and not let a few individual news events distract you from it. Our long-term model is as follows:
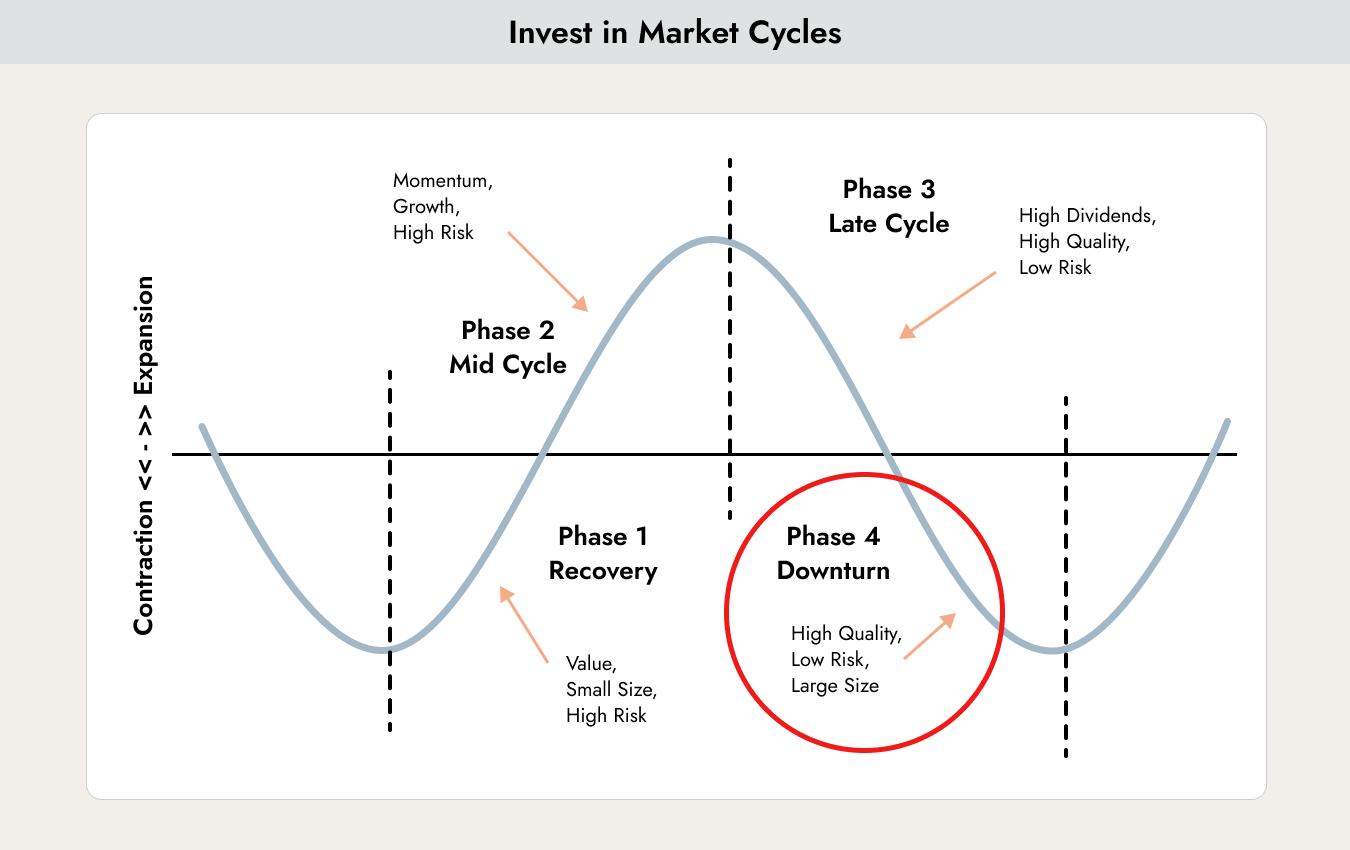
We believe that we are currently in Phase 4 of the long-term financial market cycle. The model will only shift to Phase 1 once the first interest rate cut takes place, which is currently expected in autumn 2024. Last week’s economic data is not significant enough to change our position in the long-term financial market cycle, which is why we do not react to this type of news.
Negative Leading Indicators for Economic Development
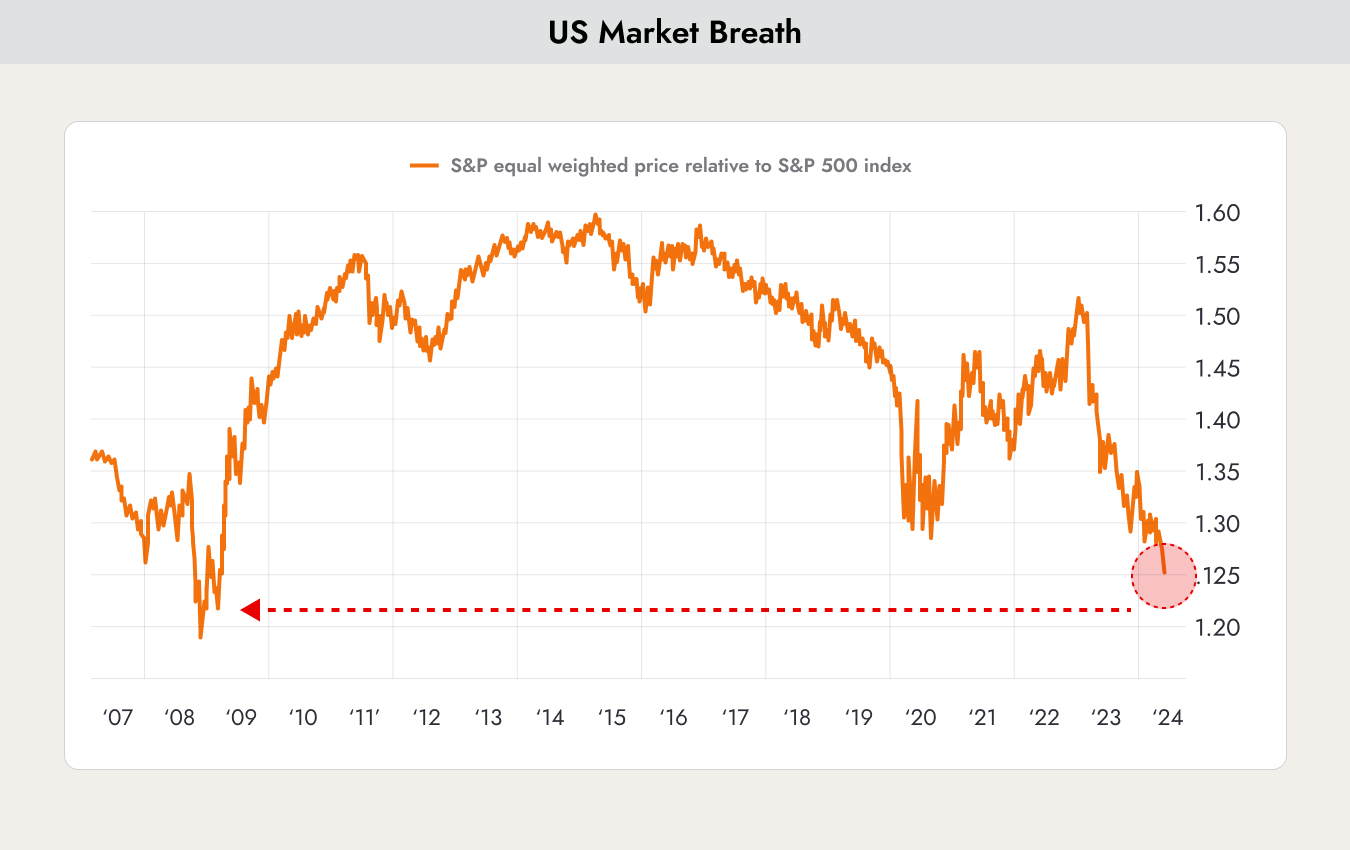
The chart shows the relative performance of the market-cap weighted S&P 500 compared to an equally weighted S&P 500 index since 2007.
In an equally weighted index, each stock in the index has the same weight, regardless of its market capitalization. The S&P 500, on the other hand, is a market capitalization-weighted index, meaning that larger companies carry a greater weight in the index than smaller companies.
The chart shows that the equally weighted version has severely underperformed the standard index recently. This suggests that a tiny handful of mega-cap stocks are heavily outperforming the average stock in the index. This is a sign of weak market breadth.
Market breadth refers to the number of stocks participating in a market move. In a bull market with broad market breadth, many stocks rise in price. In a bull market with weak market breadth, only a small number of stocks increase in price.
Weak market breadth, nearly as low as during the 2007 financial crisis, can be a cause for concern, as it may signal that a bull market is approaching its end. When only a handful of stocks are driving the market higher, fewer stocks are participating in the rally. This could indicate that the market is running out of momentum.
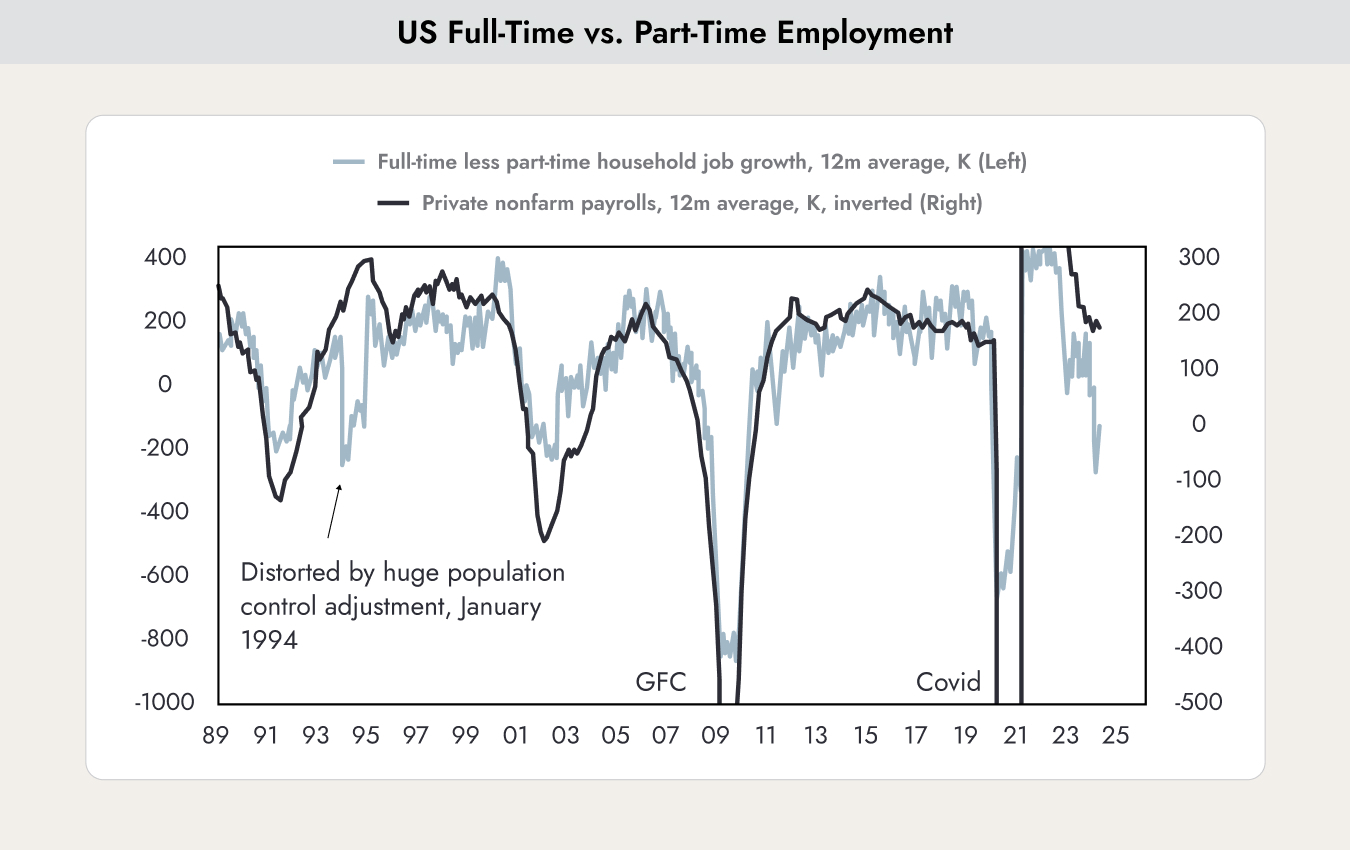
The chart shows the ratio between full-time and part-time jobs (light blue line). The declining line indicates that the share of part-time jobs is increasing. It is clear that the line trends sharply downward during recessionary periods (the GFC and COVID-19). This means that the number of part-time jobs increased more strongly than the number of full-time jobs.
Financial analysts believe that this increase in part-time jobs relative to full-time jobs is a sign of a weakening economy. There are two main reasons for this:
- During periods of economic slowdown, companies are more likely to reduce working hours rather than lay off employees entirely. This allows them to lower labor costs without incurring the severance costs associated with layoffs.
- Workers may be forced to take part-time jobs because they are unable to find full-time employment.
Historically, this has always been a leading indicator of declining full employment.
Both charts increase the likelihood, in our view, that we will see an economic slowdown or recession as the lagging effects of the recent rate-hiking cycle, one of the fastest and steepest in history, continue to filter through the economy.
Is now the time to invest in China?
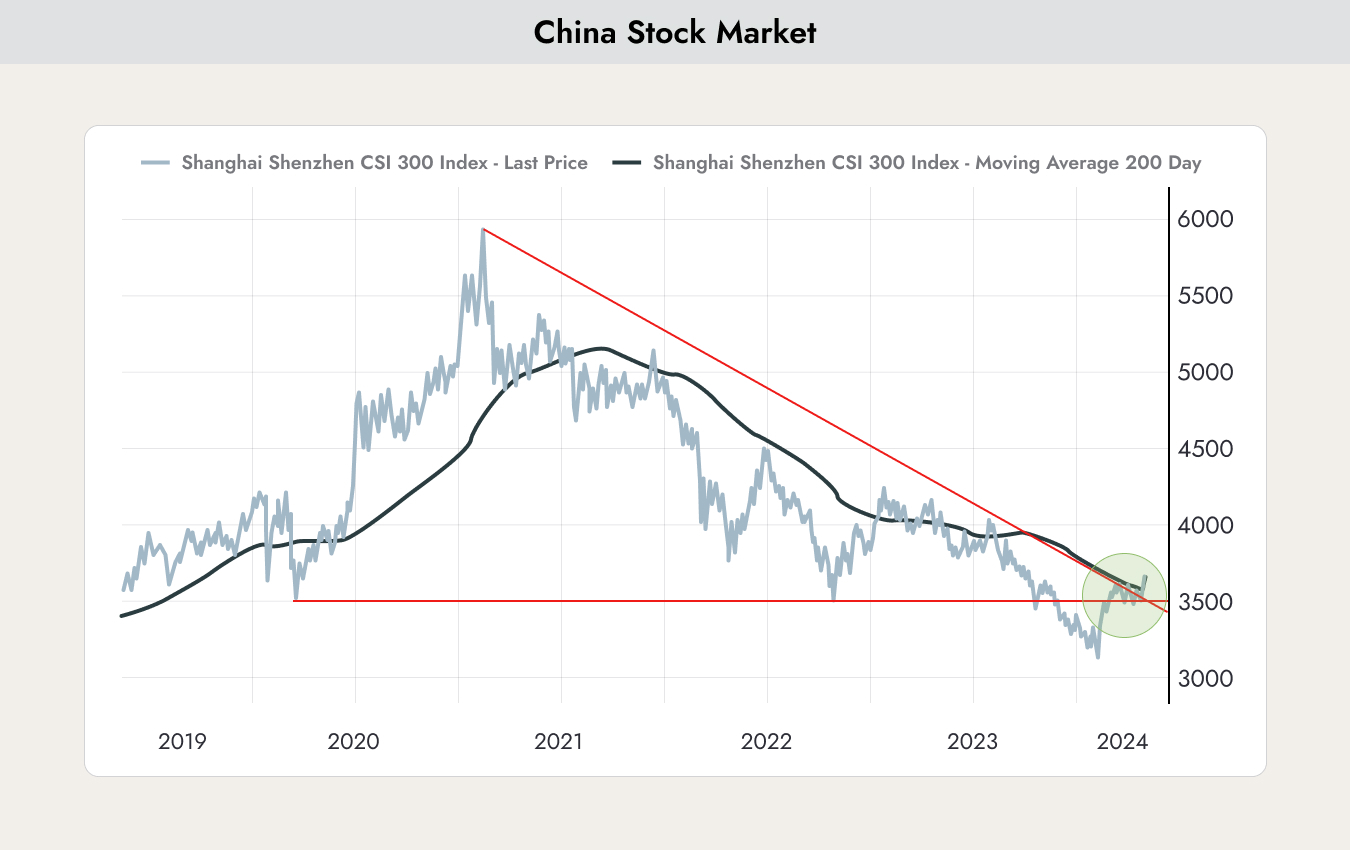
Since its peak in January 2021, the Chinese stock market (shown above using the Shanghai Shenzhen Stock Index) has lost nearly 40%. However, since its low in January 2024, the Chinese stock market has already recovered by 20%. Has the time now come to invest in China again?
The performance of Chinese stocks has been weak in recent years for the following reasons:
- China’s strict COVID policy cost the economy significant growth. In addition, the expected post-COVID recovery, similar to what occurred in most Western countries, failed to materialize.
- The real estate crisis is still not over and has significantly changed consumer behavior among the population.
- COVID exposed the challenges of overly complex global supply chains. This has led to a trend toward onshoring in industrialized nations, with production capacity being moved closer to domestic markets. Foreign direct investment from developed countries into China has declined significantly.
- China has increasingly intervened in the free market and imposed restrictions on the business opportunities of entire industries. This has discouraged many foreign investors.
- Growing rivalry between the USA and China. A few weeks ago, Biden reignited the trade war by imposing 100% import tariffs on electric vehicles. If Trump is elected president again, tensions are likely to increase even further.
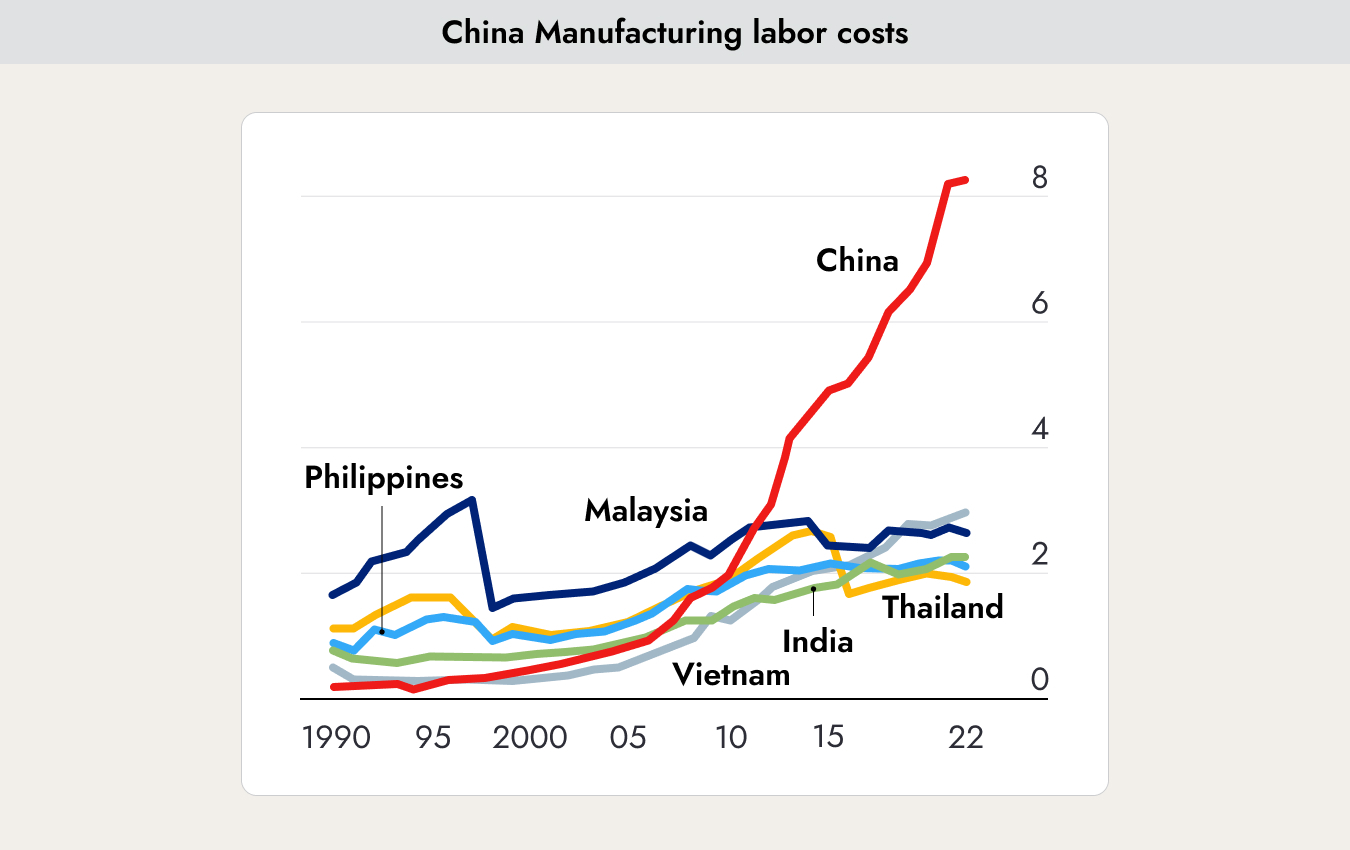
The chart highlights another reason why companies are no longer choosing China as a manufacturing location. It shows the increase in unit labor costs for manufacturing in China, measured in USD per hour. China is no longer a country where goods can be produced cheaply.
HOWEVER, HOWEVER, China is the world’s second-largest economy by nominal GDP (and the largest by purchasing power parity), while ranking highly in global innovation. China is unlikely to surpass the USA and Europe as the world’s largest economies in the near future, but it still offers opportunities for investors.
Since a great deal of negative news has already been priced in, it is quite possible that the CSI 300 has already bottomed out. However, investing in China requires a great deal of patience, and volatility is likely to remain high.
China is not just one market. There are three different markets for Chinese stocks:
- H-Shares: Stocks of Chinese companies traded in Hong Kong. The Hong Kong stock exchange has significantly stricter compliance requirements, and only Chinese companies with the strongest compliance and governance standards are able to register there. This provides investors with greater security. However, many of the companies listed in Hong Kong are highly export-oriented.
- ADRs: Shares of Chinese companies listed on a stock exchange in the USA. These companies would likely be among the first to feel the impact of an escalating trade conflict between the USA and China. There is no ETF for this segment, but individual stocks can be purchased.
- A-Shares: Shares of Chinese companies listed on local stock exchanges in China. This market includes many smaller domestic companies that operate only within the local economy. In the event of a trade conflict, some of these firms could even benefit if imports of foreign products are restricted. We currently see the best opportunities in this segment.
Conclusion: The Chinese stock market appears to be stabilizing. After losing nearly 40% in value, most of the negative news seems to have been priced in. However, patience is still required. China is unlikely to reach new all-time highs in 2024. In particular, the trade conflict with the USA is likely to continue causing periodic setbacks.


.webp)





.jpeg)




.jpeg)

.svg)


