
Chart of the Week
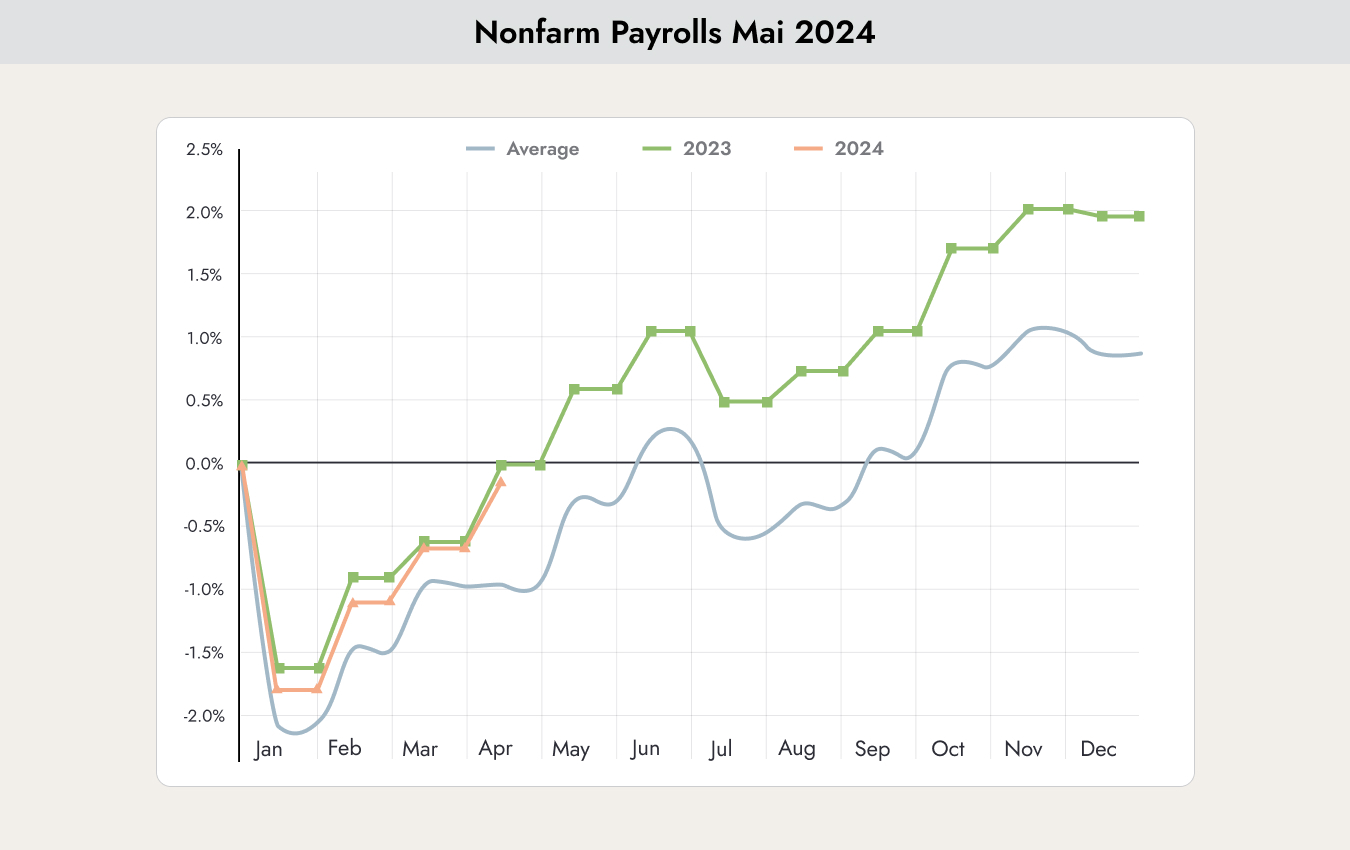
Last Friday, the latest labor market figures were published: the Nonfarm Payrolls. Nonfarm Payrolls measure the change in the number of employed people in the previous month, excluding the agricultural sector. Job creation is the most important indicator of consumer spending, which makes up the largest share of economic activity.
The chart shows the average monthly figures over the past 10 years (blue line), the figures from last year (green line), and the figures for 2024 (orange line).
An unchanged figure compared to the previous month had been expected. The published figure came in slightly lower. In other words, fewer new jobs were created than expected. As a result, the unemployment rate increased from 3.8% to 3.9%.
Why this matters
This small change helped many market participants breathe a sigh of relief. Higher unemployment increases the likelihood of an interest rate cut happening sooner. The chart above helps put the situation into better perspective. The number of newly created jobs is still significantly above the average of the past 10 years. Interpreting this small deviation from last year as a trend reversal is an overreaction. The figure would need to fall below the 10-year average to signal a genuine trend reversal.
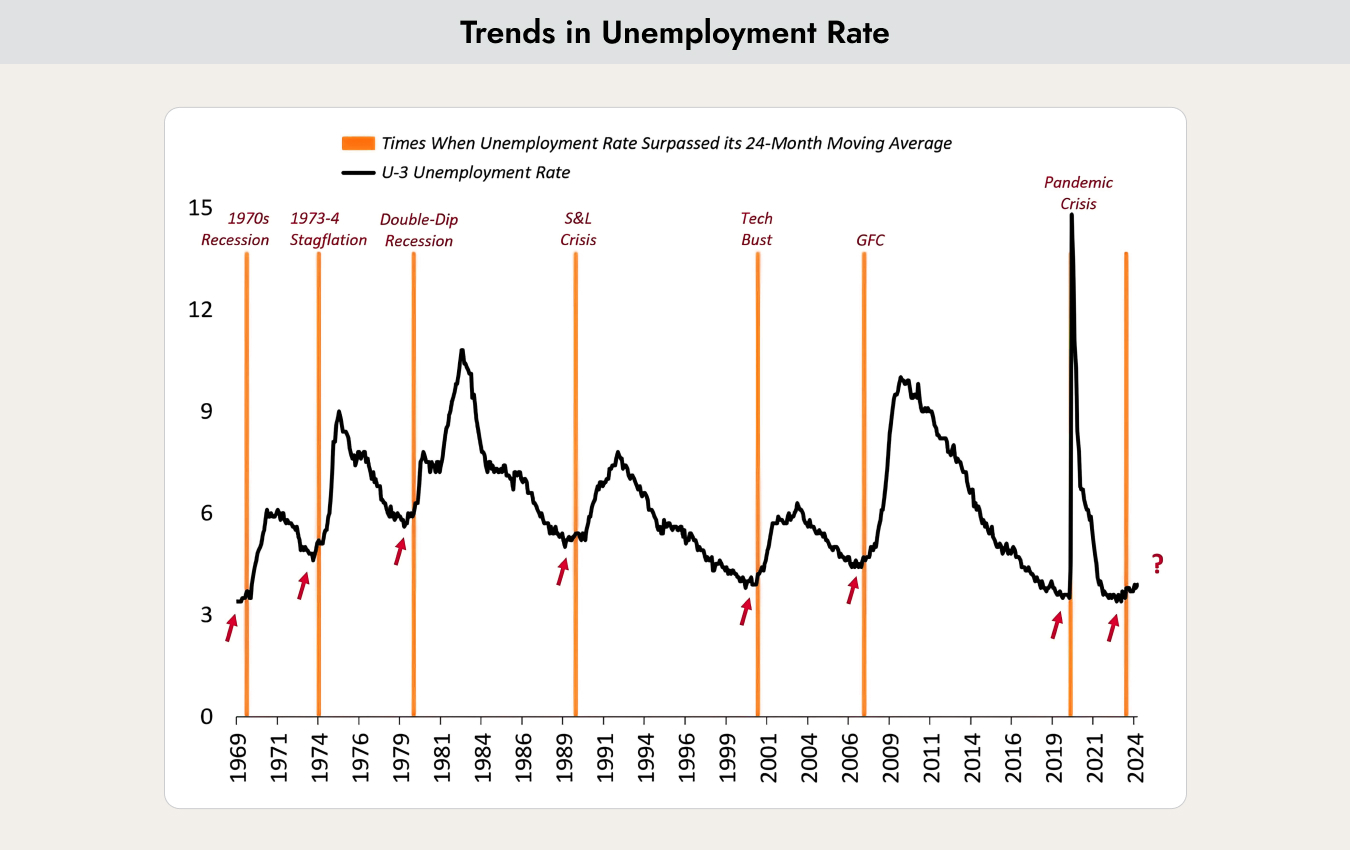
The chart shows the historical development of the U.S. unemployment rate since 1969. With the newly published figures, the average of the past 24 months has been exceeded for the first time. Since 1969, this has consistently been a sign of a major trend reversal toward higher unemployment.
If negative surprises emerge in the coming weeks, they will most likely come from this side. It is therefore advisable to monitor all developments in the labor market very closely over the next few weeks.
Is the bull market over?
Are we currently seeing just a small correction in the stock markets, or a larger trend reversal that could push prices lower through the end of the year?
The signs here are still not clear. That is also the reason for the current high volatility and uncertainty.
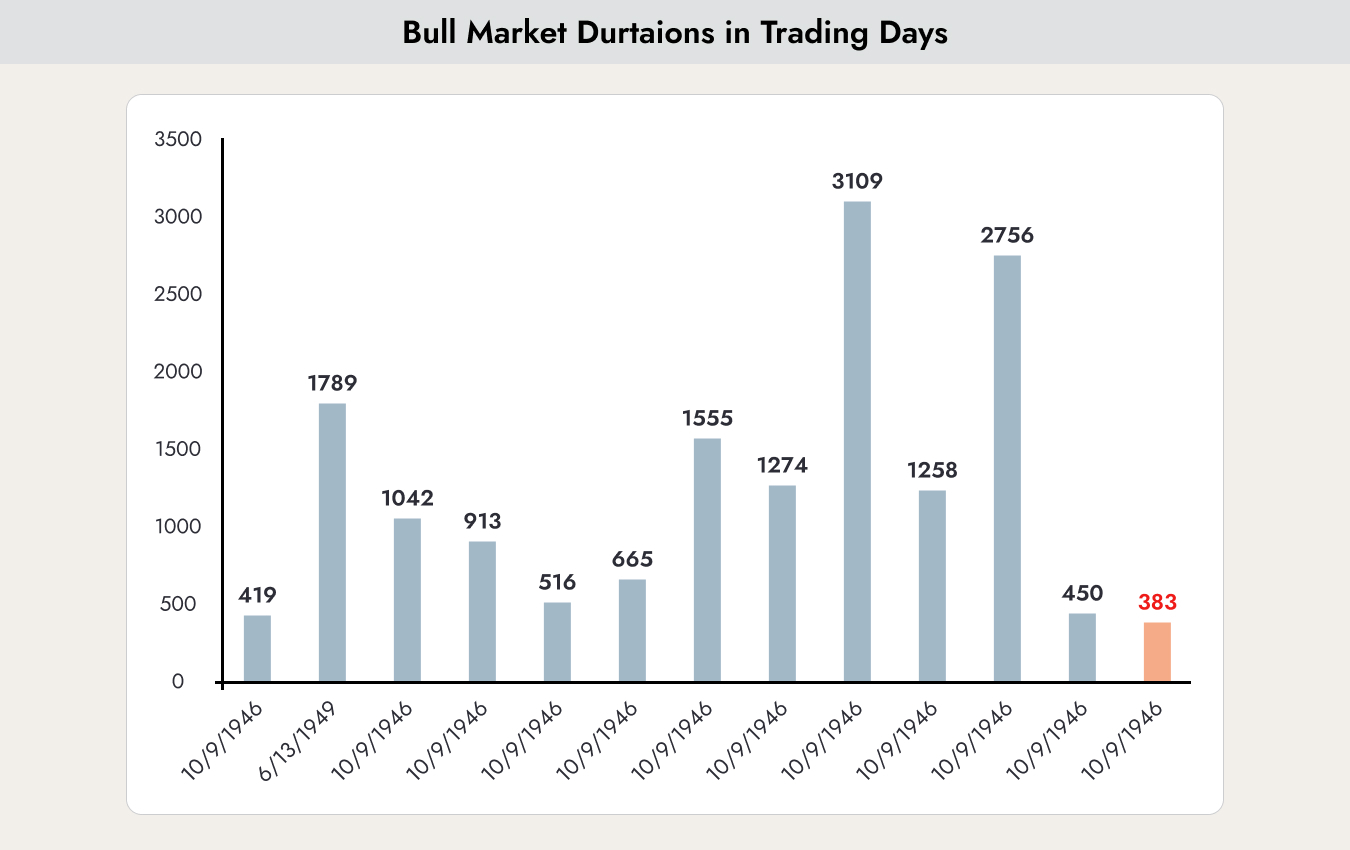
The fact is, if a major trend reversal occurs, we would have seen the shortest bull market since 1946. The chart above shows the duration in days during which the market continued to rise after an interest rate pivot without experiencing a correction of 10%.
Many therefore believe that the trend will continue — perhaps too many.
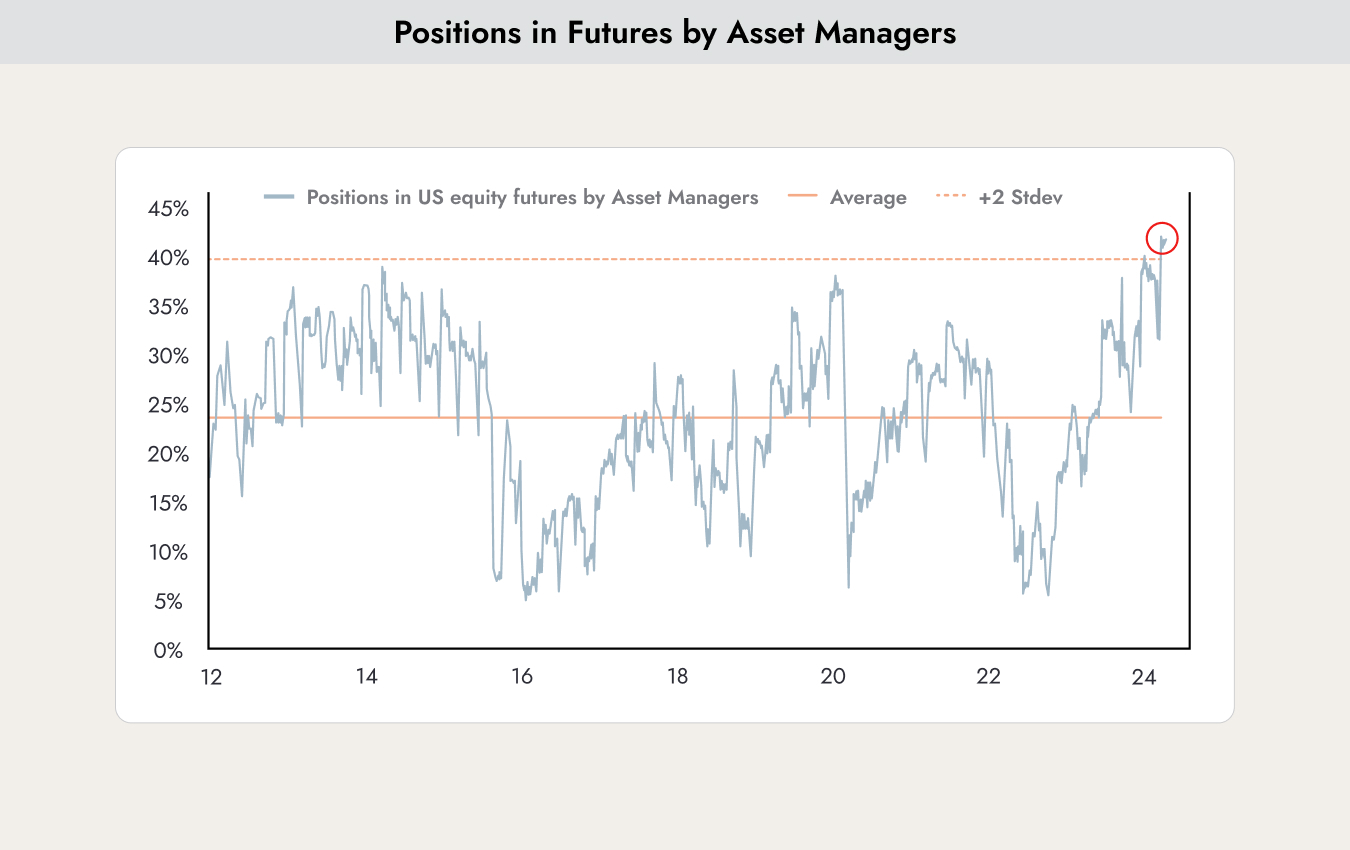
Large institutional investors typically maintain a core portfolio that they keep relatively stable over many years. When they are very optimistic about the stock market, they additionally buy futures contracts to increase their exposure. That is exactly what the chart above shows. It illustrates how many institutional investors are holding additional futures positions in their portfolios. We are seeing the highest level in the past 12 years. When nearly all major investors are already positioned far above normal levels, even good news may no longer lead to additional buying.
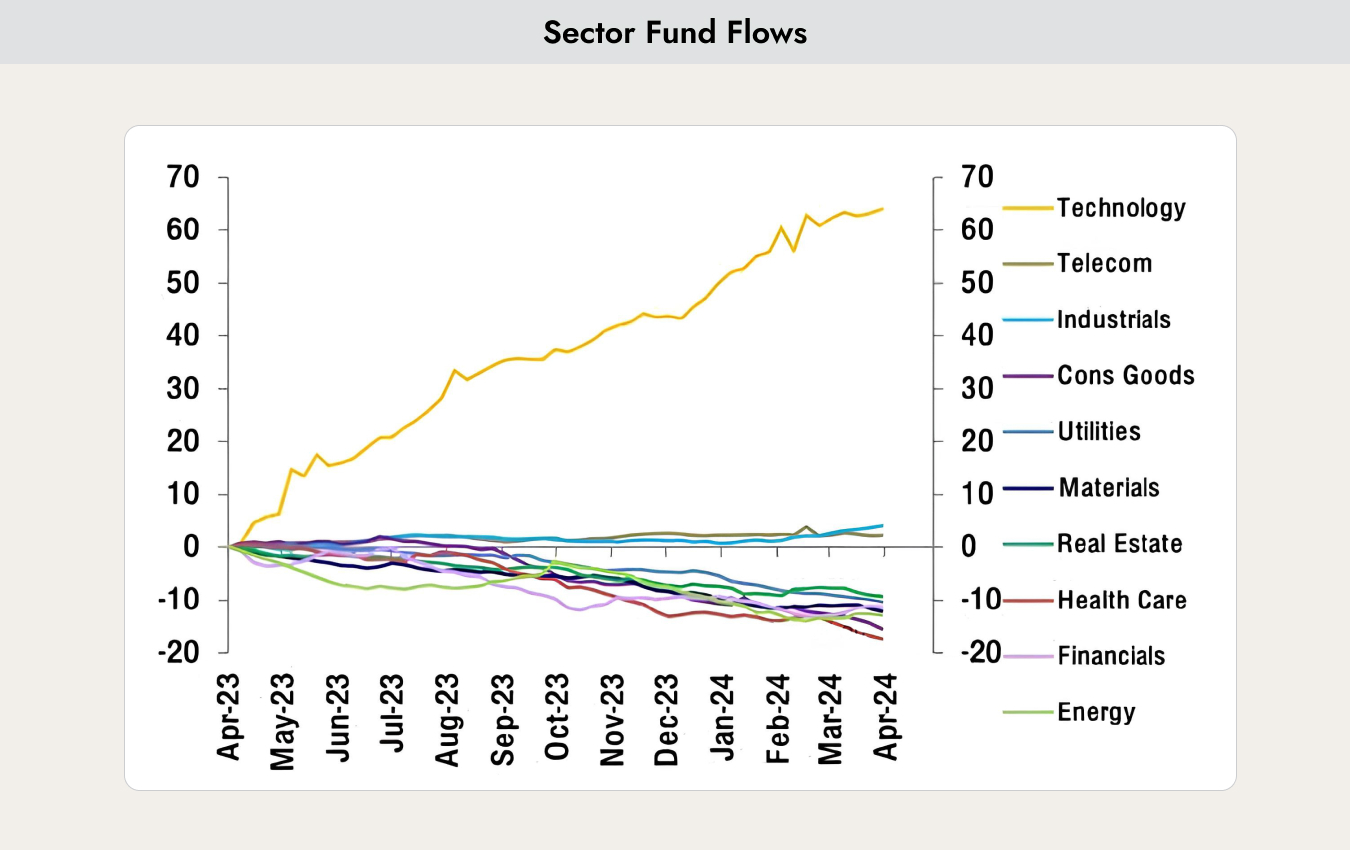
The chart shows how strongly individual sectors benefited from capital inflows over the past year. In reality, it was mainly the technology sector that attracted additional funds. If a correction now occurs, it is therefore likely that this sector will be hit the hardest.
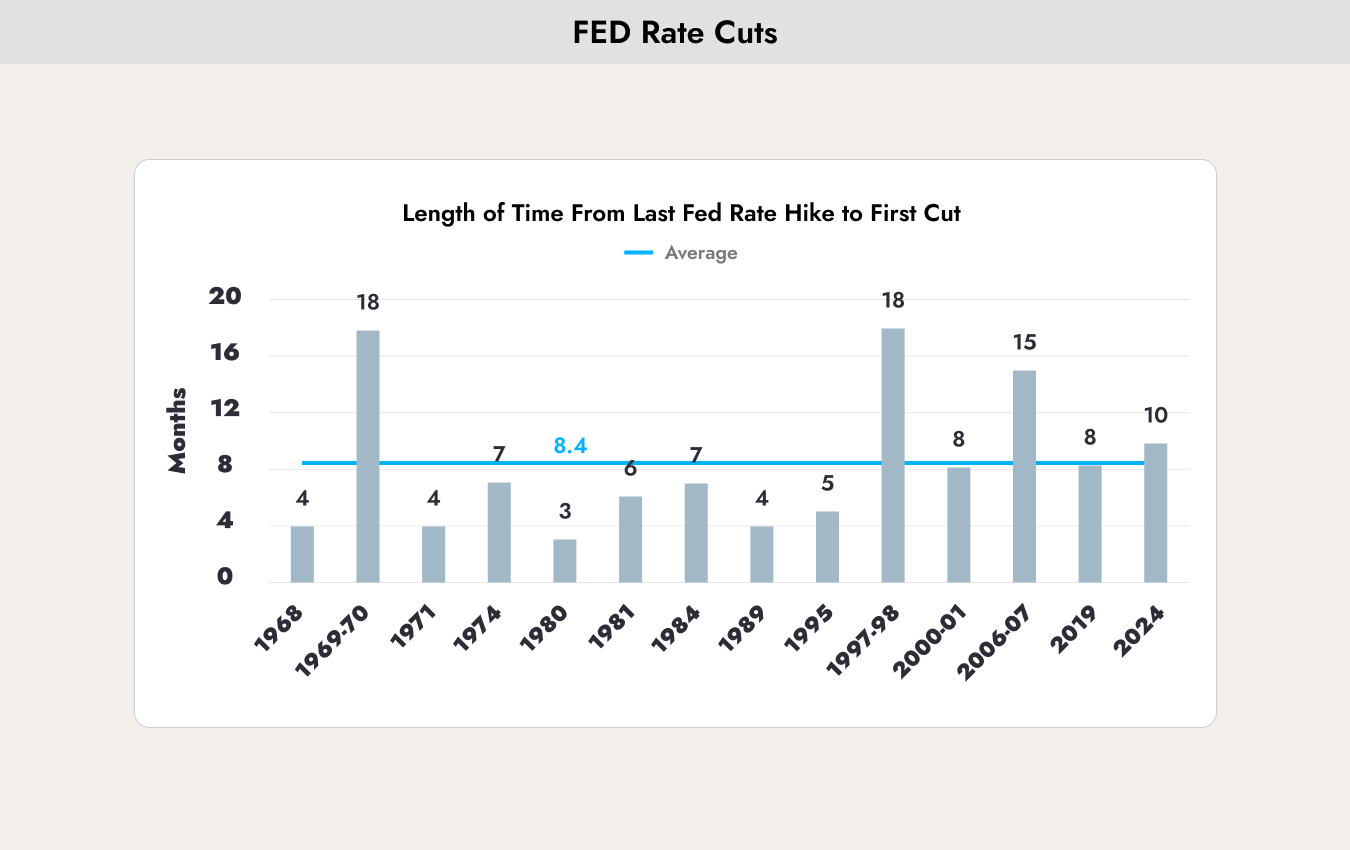
After the rather pessimistic outlook, here is an argument for the optimists as well. The chart shows how long it took over the past 50 years for the U.S. central bank to make its first interest rate cut following the last rate hike.
It has been 10 months since the last interest rate hike. The current expectation is for the first rate cut to take place in September 2024. That would put this cycle at 14 months. The expected rate cut is therefore entirely realistic.
Is now the time to invest in Europe and emerging markets?
For investors, there are two investment philosophies that are diametrically opposed:
- "The Trend Is Your Friend". Trends generally last longer than most people expect. Therefore, it makes sense to invest with the trends rather than against them.
- "Mean Reversion" or "Contrarian Investing". Back to the mean. When prices move significantly away from their long-term average, they tend to revert back toward that long-term average.
Trend-following strategies are generally superior over the long term. However, investing too late in a trend can still lead to significant losses.
Contrarian strategies can generate substantial returns, but they often require patience, as investors frequently bet on a trend reversal too early.
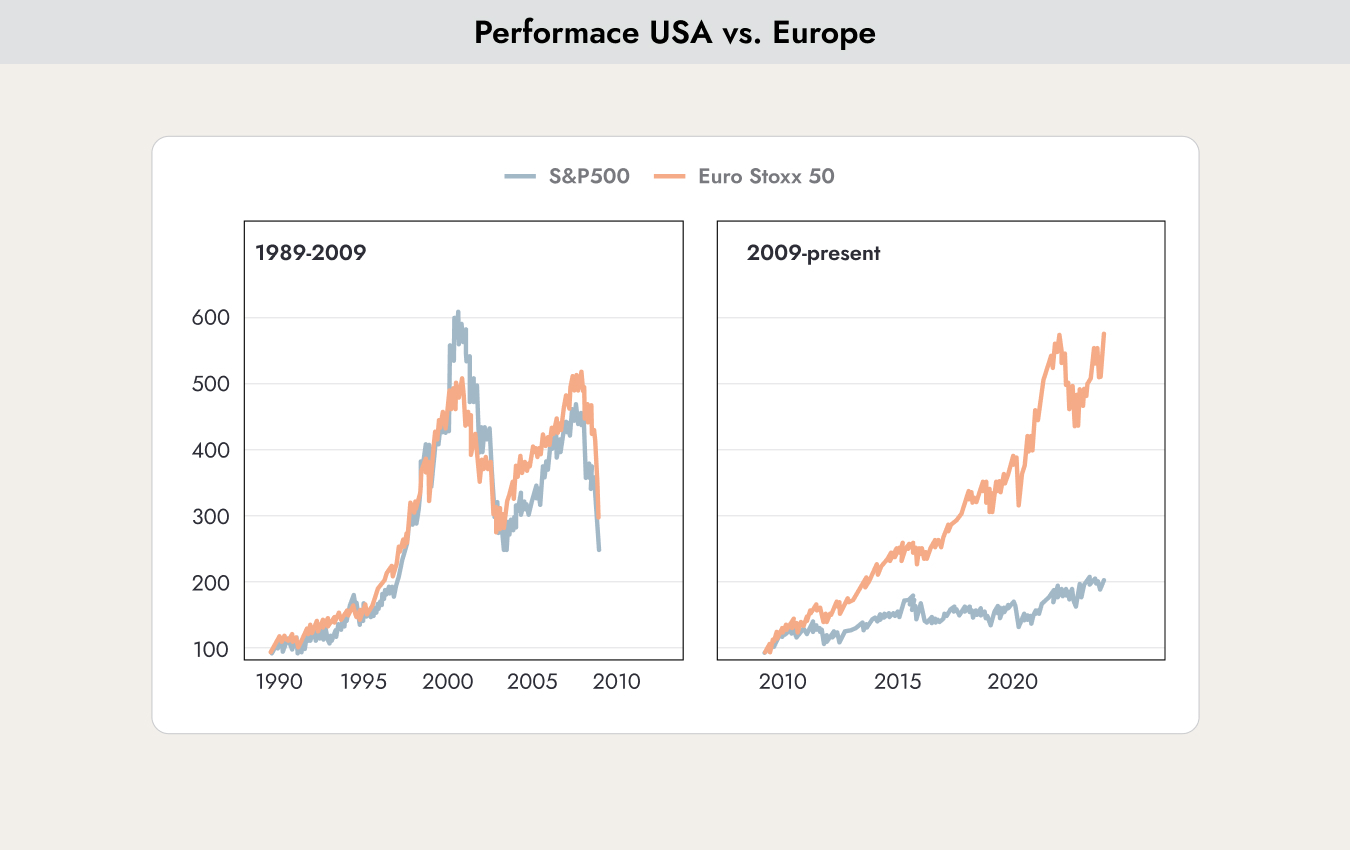
The chart shows that the returns of the U.S. and European stock markets from 1989 to 2009 — a period of 20 years — were almost identical. However, from 2009 to today, the U.S. stock market has outperformed Europe by a wide margin. So, is now the time to bet on Europe?
The current trend could easily continue for another 2–5 years. Long-term trends of this kind require a catalyst to reverse, and at the moment, no such catalyst is in sight. Almost all future-oriented solutions related to artificial intelligence are coming from the U.S. Meanwhile, Europe is facing a war on its doorstep.
A possible catalyst would be a debt crisis in the U.S. and a collapse of the USD against the euro. However, there are currently no signs of this happening.
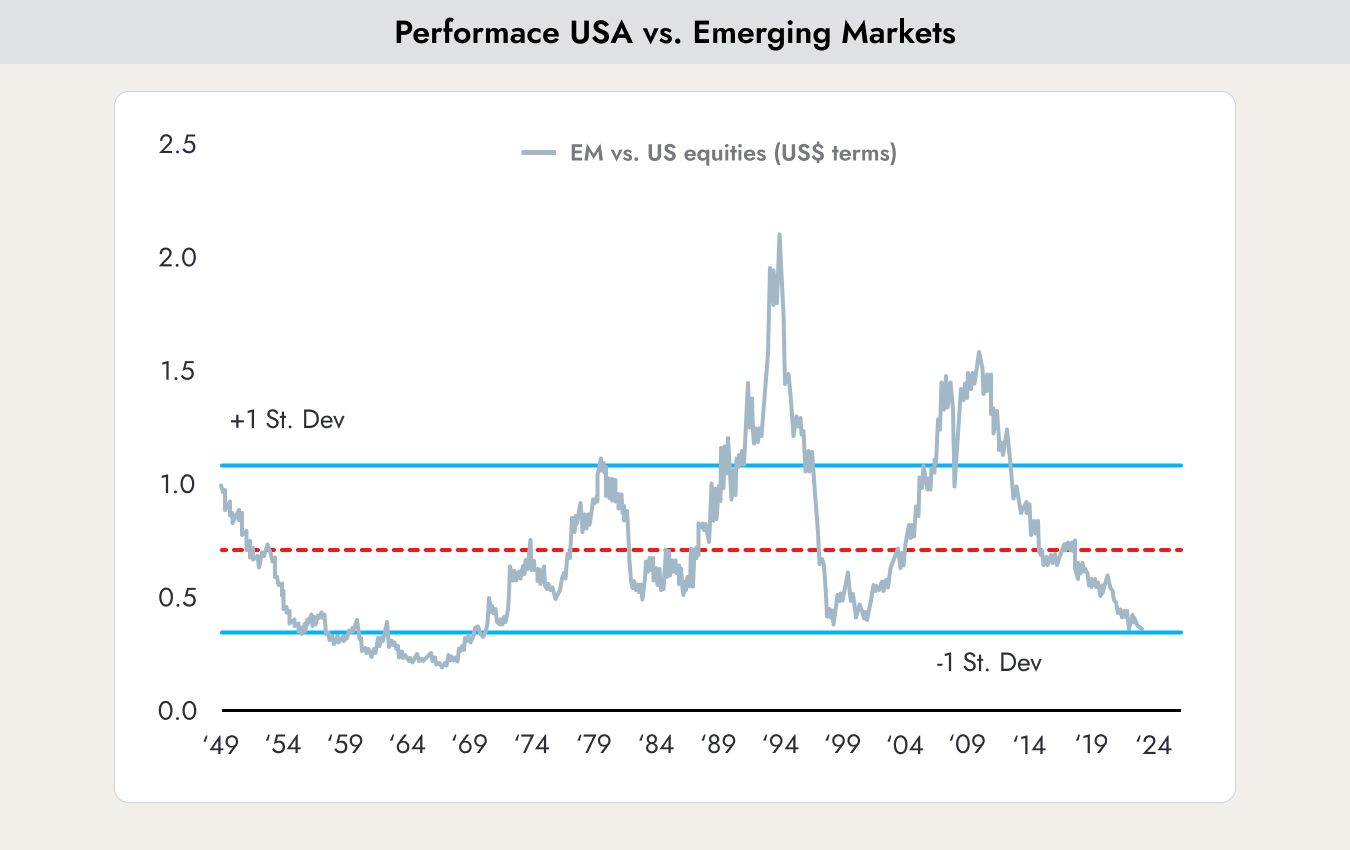
The chart shows the performance gap between U.S. stocks and emerging market equities. We are currently seeing the largest underperformance of emerging market stocks since 1964. So, is now the time to bet on Europe?
Globalization led the U.S. and Europe to outsource much of their production to Asia and emerging markets. However, the COVID crisis exposed the risks of overly globalized supply chains to many companies. If production of even a single component is disrupted in one country, entire supply chains can collapse.
Political tensions between the U.S. and China are also having a negative impact and creating uncertainty. Sanctions can cause entire supply chains to break down.
In addition, disruptions to key shipping routes such as the Strait of Hormuz or the Suez Canal due to conflicts in the Middle East are adding further pressure.
These developments have led U.S. and European companies to build new factories closer to their main markets once again. This trend is known as onshoring or deglobalization.
In light of these new trends, we do not believe in a major shift toward investments in emerging markets.
Here as well, a catalyst would be needed for a trend reversal. This could include a change in government in China that leads to easing tensions or a long-term resolution to conflicts in the South China Sea. Another possibility would be China fully adhering to WTO rules and no longer heavily subsidizing strategically important sectors through state support.


.webp)





.jpeg)




.jpeg)

.svg)


