
Chart of the Week
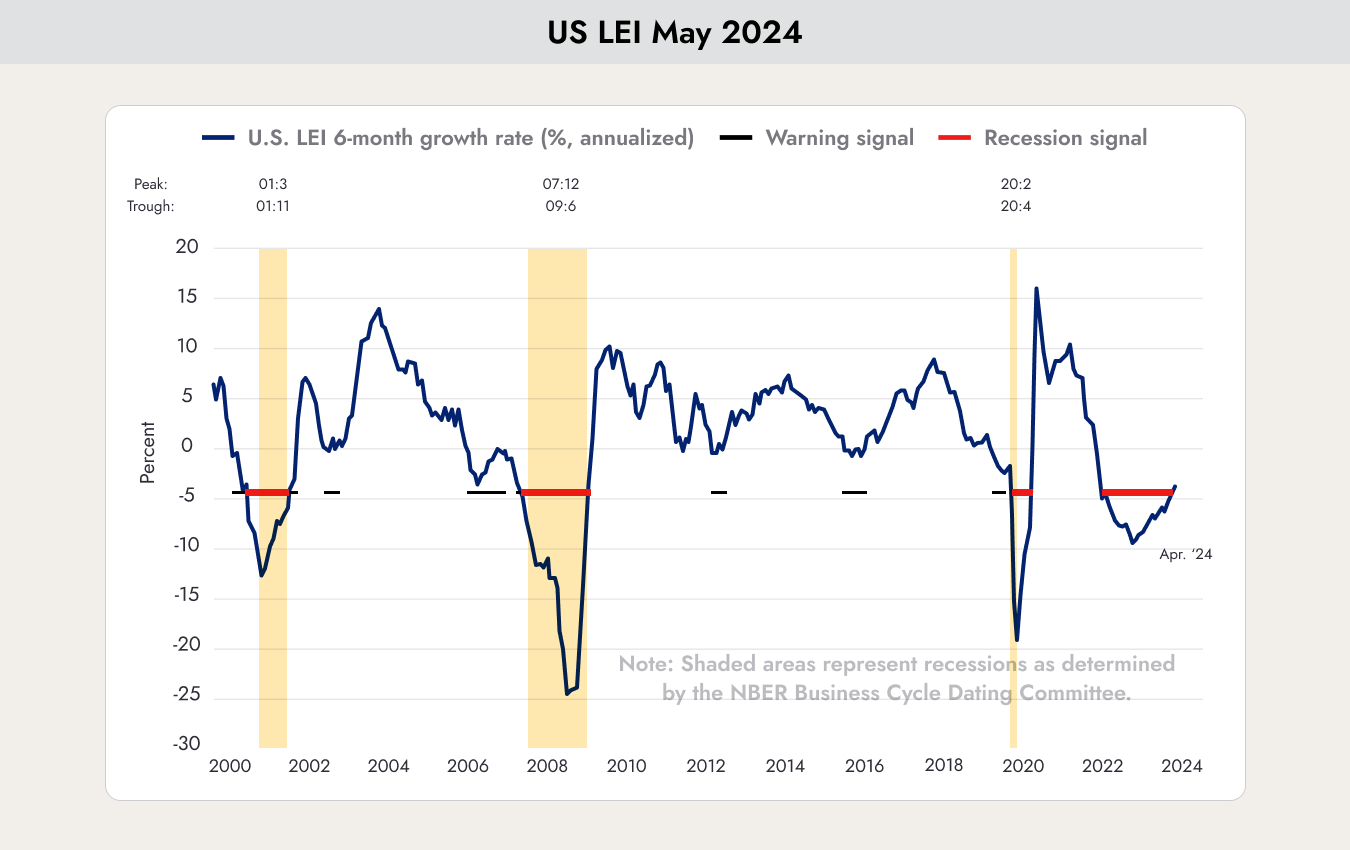
The present chart shows the annual growth rate of the U.S. Leading Economic Index (LEI) from January 2000 to April 2024. The LEI is measured on a six-month annualized basis and expressed as a percentage. The chart illustrates three key elements:
- The blue line represents the annual growth rate of the LEI.
- Red sections indicate recession signals.
- Black sections indicate warning signals for potential economic downturns.
The yellow vertical bars mark periods of economic recessions, as identified by the NBER Business Cycle Dating Committee.
Why This Matters
The Leading Economic Index (LEI) is a composite economic indicator published by The Conference Board. It consists of ten economic indicators that serve as leading indicators of economic activity. These indicators include, among others:
- Manufacturing new orders.
- Initial unemployment claims.
- Stock prices.
- Money supply growth.
- Interest rate spreads.
The LEI is frequently used to forecast future economic activity and turning points in the business cycle. A declining LEI may indicate an upcoming recession, while a rising LEI suggests an economic recovery or expansion.
Historically, whenever the LEI fell into negative territory and remained there, there was a high probability of a recession occurring. This was particularly the case in 2000, 2008, and 2020, as shown by the yellow recession bars in the chart.
For the first time since 2000, the LEI has moved above the -5% threshold without a recession occurring. But are we already in the clear, with a recession off the table? Not quite, as other indicators paint a very different picture.
Major economic indicators | Marmot Finance
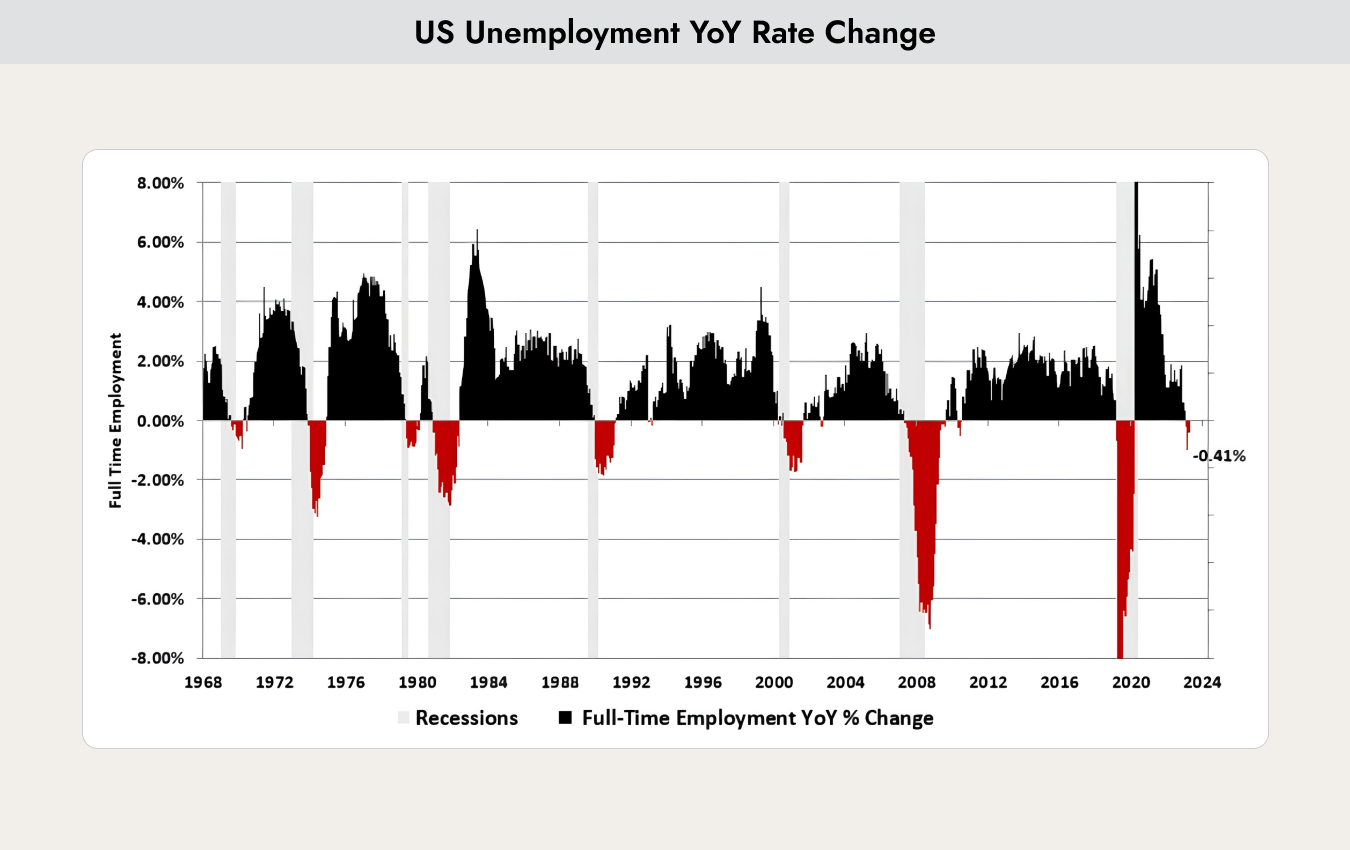
The present chart shows the year-over-year (YoY) percentage change in full-time employment in the United States from 1968 to 2024. The data is presented as a percentage and illustrates the annual growth rate or decline in full-time employment. The key elements of the chart are:
- The black areas represent the positive year-over-year change in full-time employment.
- The red areas indicate the negative year-over-year change in full-time employment.
- The gray vertical bars represent recession periods, as defined by the NBER Business Cycle Dating Committee.
At the present time, based on the latest data points in the chart, we can see that the year-over-year change in full-time employment is negative (-0.41% in 2024). This decline resembles patterns observed during previous recession periods. Although the current negative reading is less severe than in some past recessions, it points to a slowdown in the labor market.
In summary, the current negative change in full-time employment serves as a warning signal of a potential upcoming recession in the United States. The historical correlation between negative changes in full-time employment and economic downturns reinforces this concern.
As explained in previous market reports, we are currently seeing roughly half of the economic indicators suggesting that a recession is no longer coming, while the other 50% indicate that it is now approaching.
In a market phase like this, it is best to act very conservatively. It may mean earning slightly less if the stock market rises sharply, but in return, you are better protected if a recession does materialize after all.
Is Nothing Being Transported Anymore?
One possible reason why many economic indicators are no longer functioning as expected is that the U.S. economy has fundamentally changed.

The present chart shows the development of the Truck Tonnage Index (TTI) compared to the S&P 500 Index from 2002 to 2024. The chart uses two Y-axes:
- The left Y-axis (LHS) represents the Truck Tonnage Index in orange.
- The right Y-axis (RHS) represents the S&P 500 Index in blue.
From 2000 to 2020, there was a very high correlation between the two indices. Everything that is consumed must also be transported. This correlation goes back even further. One of the oldest technical indicators, already observed by Charles Dow, was the comparison between the Dow Jones Industrial Average and the Dow Jones Transportation Average.
The Truck Tonnage Index reflects real economic activity, particularly in the freight transportation sector. A stable or rising TTI points to healthy industrial activity and consumer demand. While the TTI shows a more stable but less dynamic trend, the sharp rise in the S&P 500 reflects investor optimism, supported by favorable financial conditions and positive expectations for corporate earnings.
Since the COVID crisis, the economy has been changing. The major surge in technology stocks began, gaining even more momentum through the trend toward artificial intelligence.
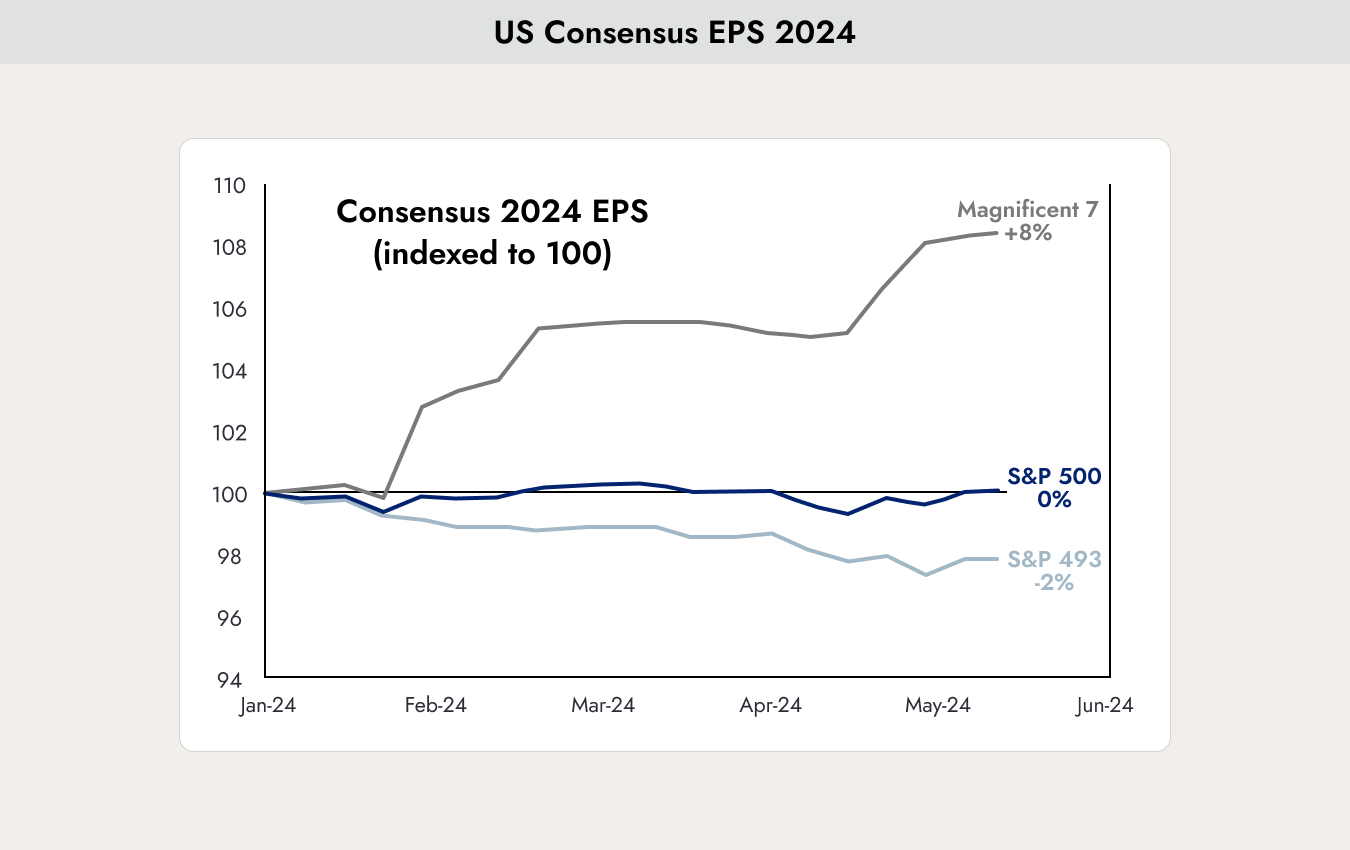
The chart shows the expected earnings of the Magnificent 7 through the end of 2024 (gray line) and those of the remaining 493 companies (blue line) in the S&P 500 (black line).
No major earnings growth is expected for the overall index. All projected earnings growth is coming solely from the Magnificent 7 (Apple, Microsoft, Alphabet, Amazon, NVIDIA, Meta, and Tesla).
As a result, many traditional economic indicators are struggling to adapt. This is also the reason for the highly conflicting signals they are currently providing.

The chart illustrates how significant the weighting of the largest 10% of companies by market capitalization is within the S&P 500. Only twice since 1926 has the weighting been as high as it is today:
- 1926 to 1933: This was the era of the Great Depression. The stock market was dominated by value stocks of companies producing everyday consumer goods, such as Procter & Gamble, Coca-Cola, and utility companies in the electricity sector.
- 1998 to 2000: The “first” technology bubble. Companies associated with the internet surged to astronomically high valuations.
Will the artificial intelligence trend change our lives? The answer is clearly yes, but there are still limits. More and more regulations are being introduced that restrict its use and, in turn, the earning potential of companies. This could happen within the next six months, or it may take up to the next two years.
Still, 90% of the things we consume must be transported. The “old” economic indicators are not dead yet either.
Investor Positioning
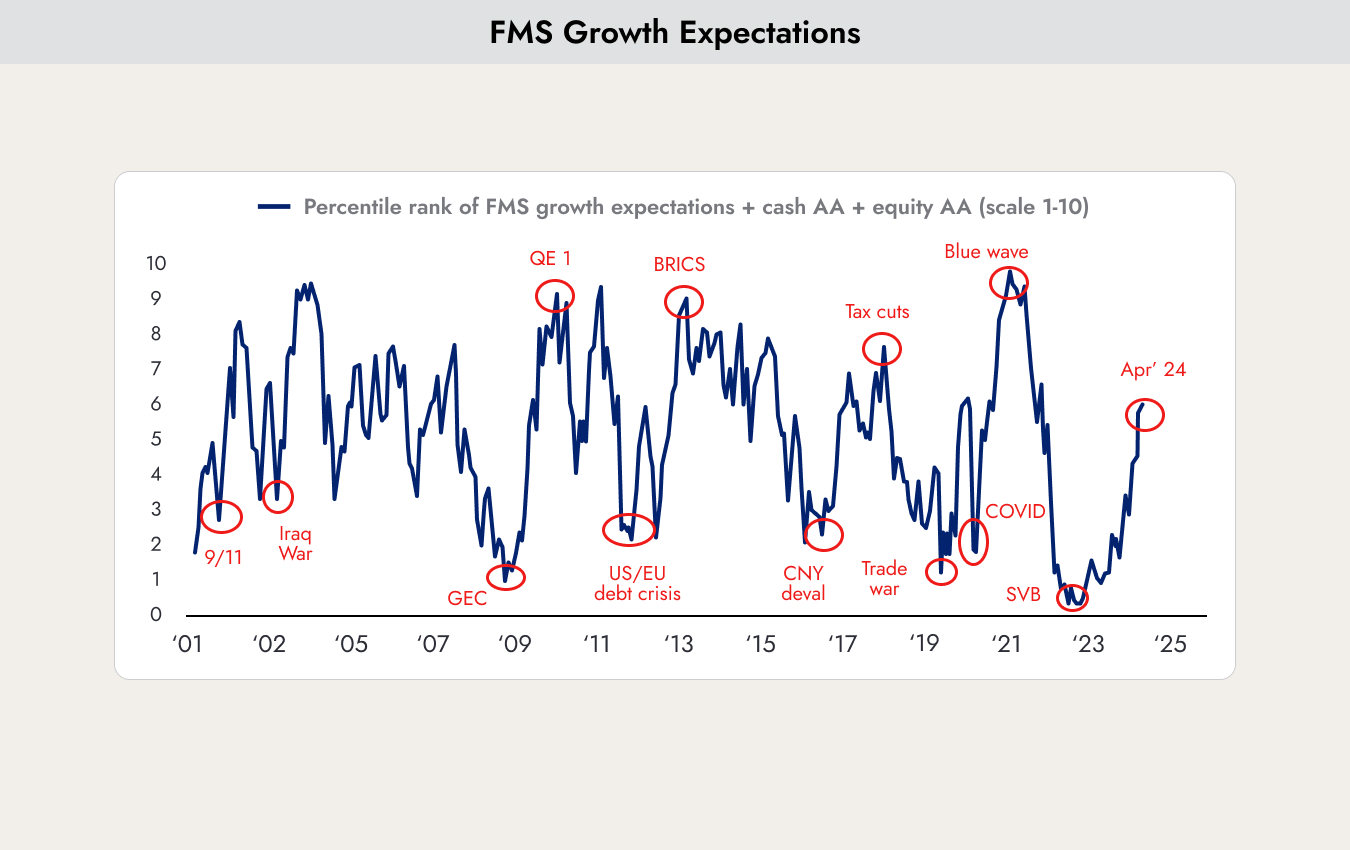
The chart shows an index indicating how heavily institutional investors are positioned in equities. The index combines institutional investors’ expectations, as well as the allocation share between equities and cash in their asset allocation.
When the index reaches its maximum, investors’ return expectations are unrealistically high, and they have exhausted their cash reserves to buy additional stocks. This is typically when a larger market correction occurs.
The index shows that we are close to historical highs, but there is still room for further gains. This means institutional investors still have some cash available to push prices higher, though not much. However, the situation is becoming increasingly risky, and a market correction could occur at any time.
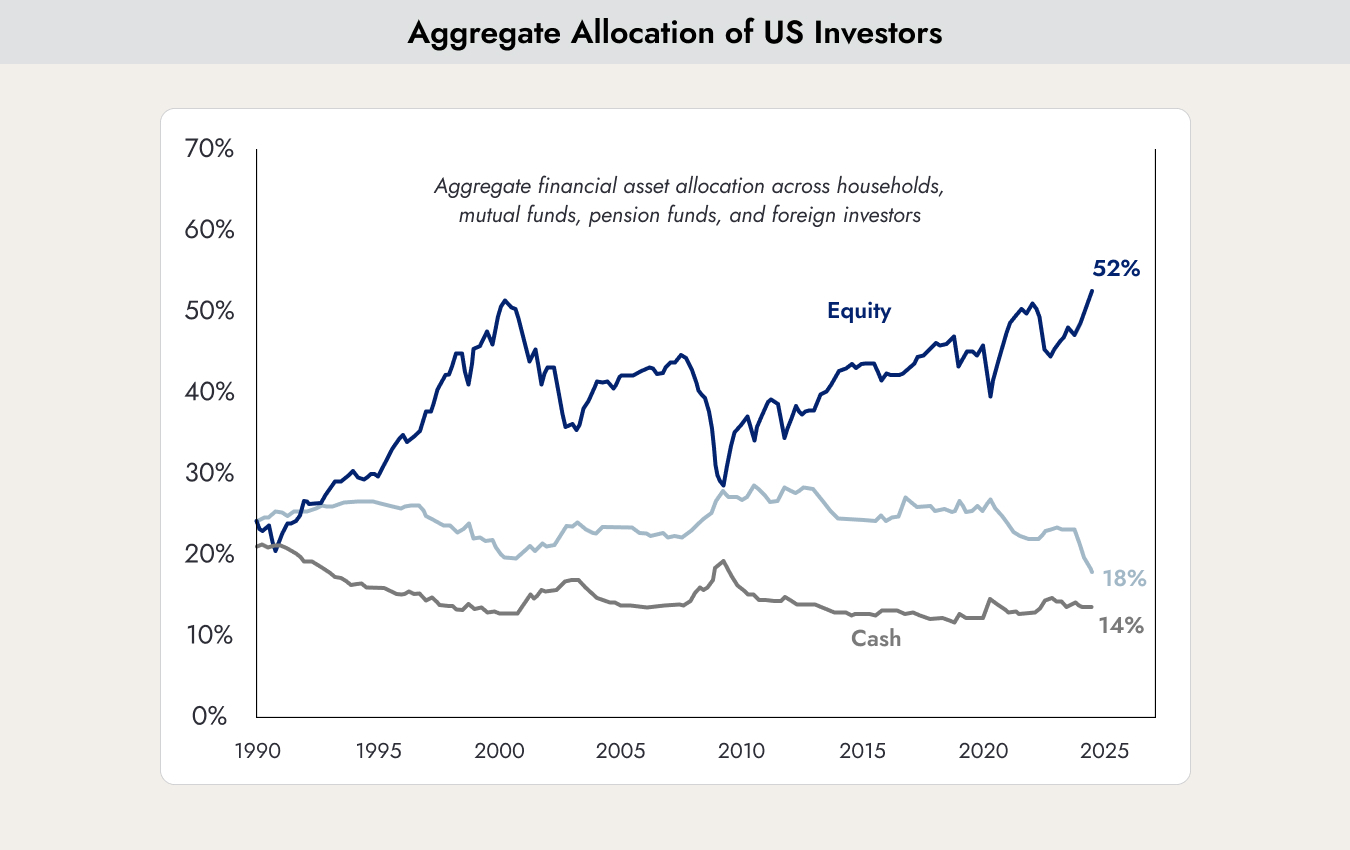
The chart shows the asset allocation of pension funds and foreign investors in the United States. Here, the picture looks more concerning. Equity allocation is at its highest level in the past 35 years. Large-scale stock purchases from these investors are no longer expected.
The conclusion from both charts is that the potential buying power available to investors to push markets higher is becoming increasingly limited. In a phase like this, it is wise to reduce portfolio risk somewhat.


.webp)





.jpeg)




.jpeg)

.svg)


