
Chart of the Week
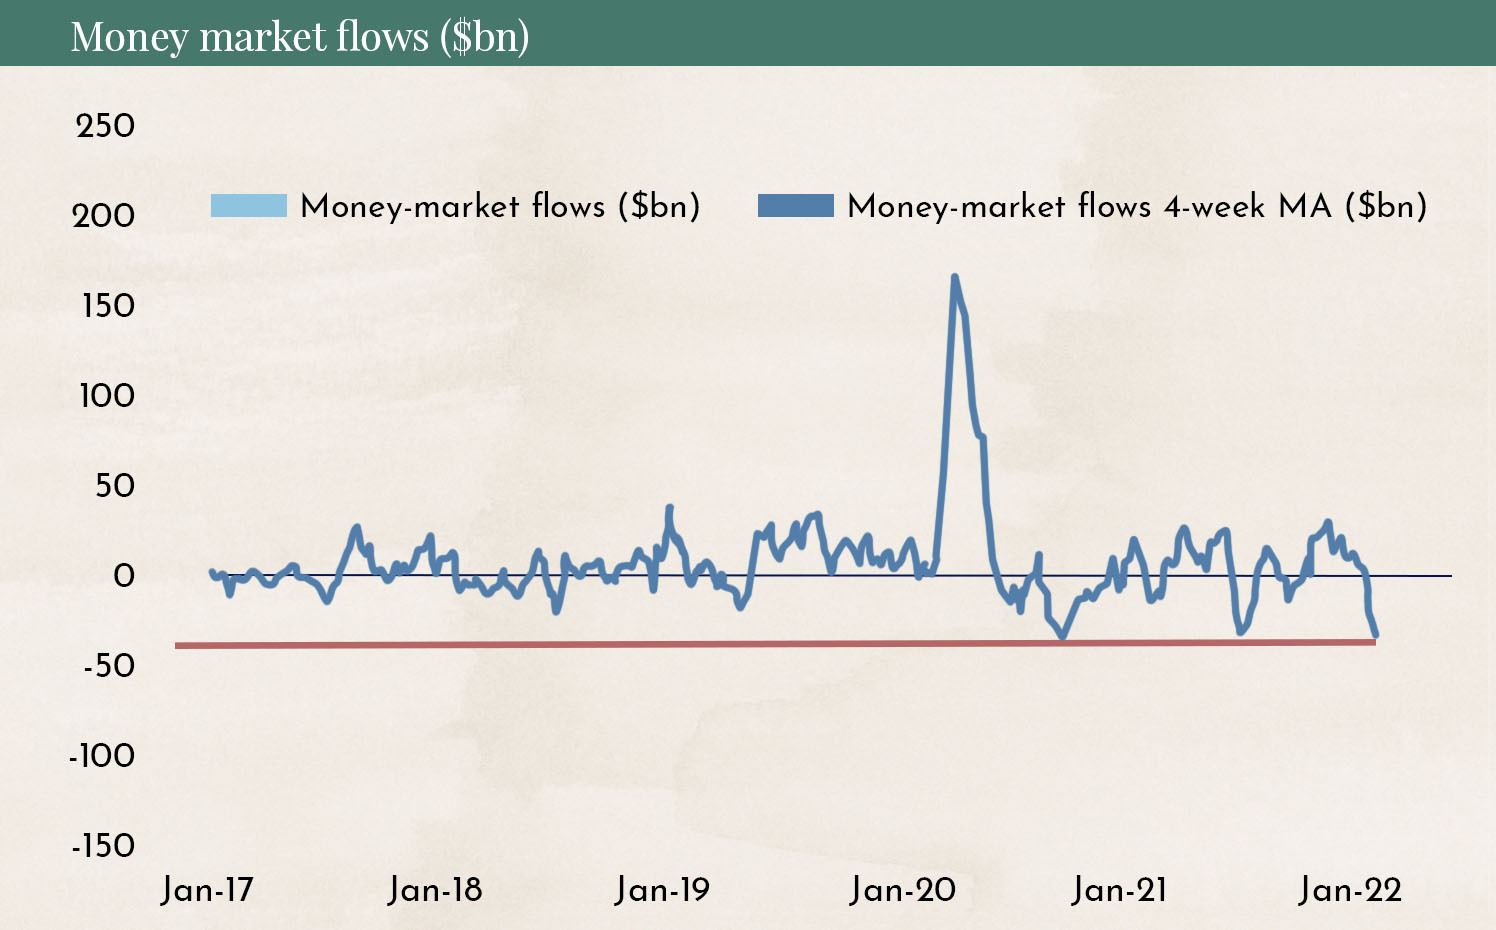
The chart shows how much money investors have withdrawn from the U.S. stock markets in recent weeks. The outflows have reached a new low since January 2017.
Why This Matters
The chart shows how pessimistic many investors are. But it also indicates that most investors who wanted to sell have already sold. Historically, such moments have often been followed by renewed buying and a corresponding rebound in the stock market.
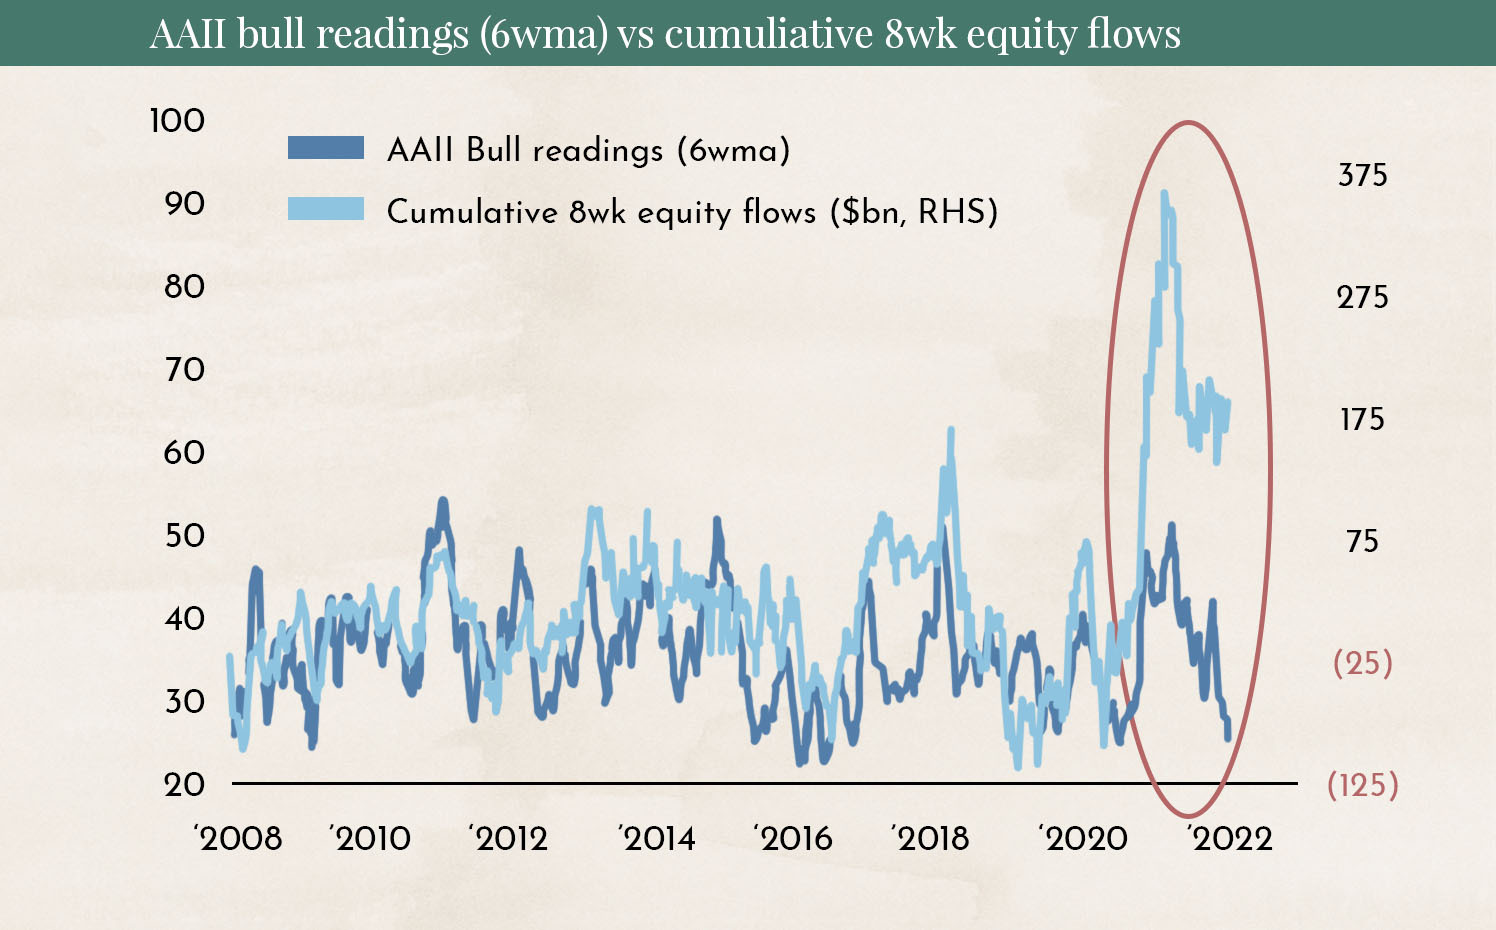
A very similar picture is shown by the American Association of Individual Investors Sentiment Index (AAII). Selling activity has been clearly above average, and at these low levels, investor sentiment has usually reversed.
Those who have not sold yet should not do so now. Those with cash in their portfolio should consider entering the market at this point.
Mixed Earnings Reports and Fear of the Ukraine Crisis.

The chart shows the performance of individual sectors in the S&P 500 compared to the overall index. Since the beginning of the year, market leadership has shifted completely. All sectors that were market favorites last year have underperformed the broader benchmark. Such a January effect is not uncommon in the stock market.
The ongoing earnings season has received little attention from many investors. Fears of an escalation of the crisis in Ukraine are spreading. U.S. President Joe Biden has clearly stated that the United States would not go to war over Ukraine. In addition, Ukraine is economically insignificant. So why is the stock market reacting so negatively to the crisis?
If Russia invades Ukraine, severe sanctions will be imposed on Russia, and it will likely be cut off from the international payment system SWIFT. This would lead to shortages in oil and gas supplies. Prices have already risen sharply. As a result, inflation would likely accelerate further across Europe and also in the United States.
Russia has so far been very skillful in foreign policy and has often taken advantage of weaknesses in the U.S. or Europe to strengthen its position. An invasion now, while the whole world is watching, seems uncharacteristic and unlikely in our view. In addition, Russian President Vladimir Putin would come under domestic pressure if he invaded a country seen as strategically less significant, such as Ukraine. Crimea was different. That is where Sevastopol is located, home to the Russian navy’s only warm-water port.
Bitcoin is currently reacting very strongly to the Ukraine crisis. This is related to the fact that after Bitcoin was banned in China, many miners relocated their operations to Russia. If severe sanctions were imposed on Russia, miners might no longer be able to transfer their Bitcoins out of the country.
Stock Splits.
Google announced a 20-for-1 stock split this week. On July 15, 2022, Google’s share price will be reduced by a factor of 20, and each investor will receive 19 additional shares. In recent years, the topic had somewhat faded from attention.
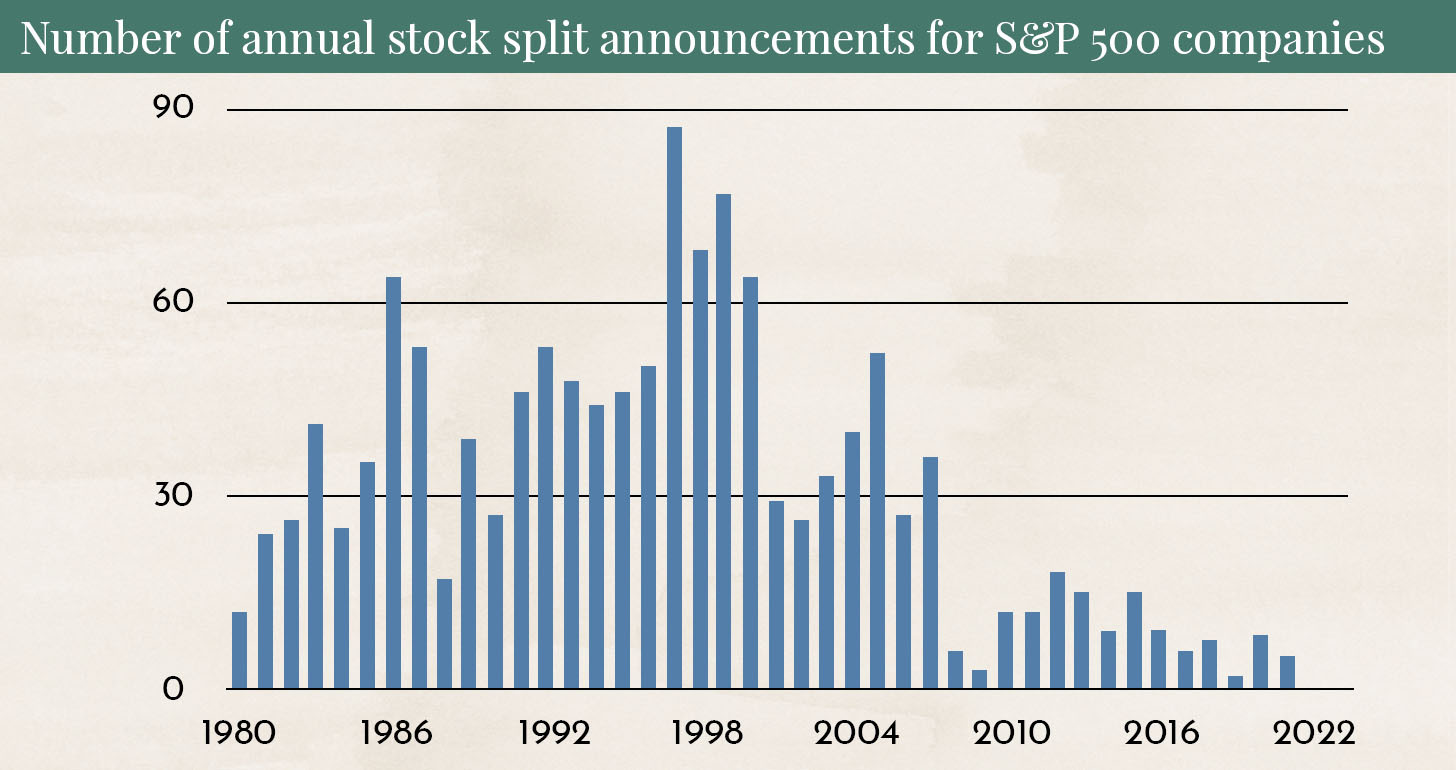
The chart shows how significantly stock splits have declined in recent years.
Google stock is currently priced at USD 2,865. For retail investors who want to build a diversified portfolio of 15 to 20 stocks, this can be problematic. If they do not want to allocate more than 5% to Google, they would need to invest a total of USD 57,000. If the share price falls to USD 143 after the stock split, a diversified portfolio could already be built with around USD 2,850.
A stock split therefore usually boosts demand for the stock. This has been historically documented:
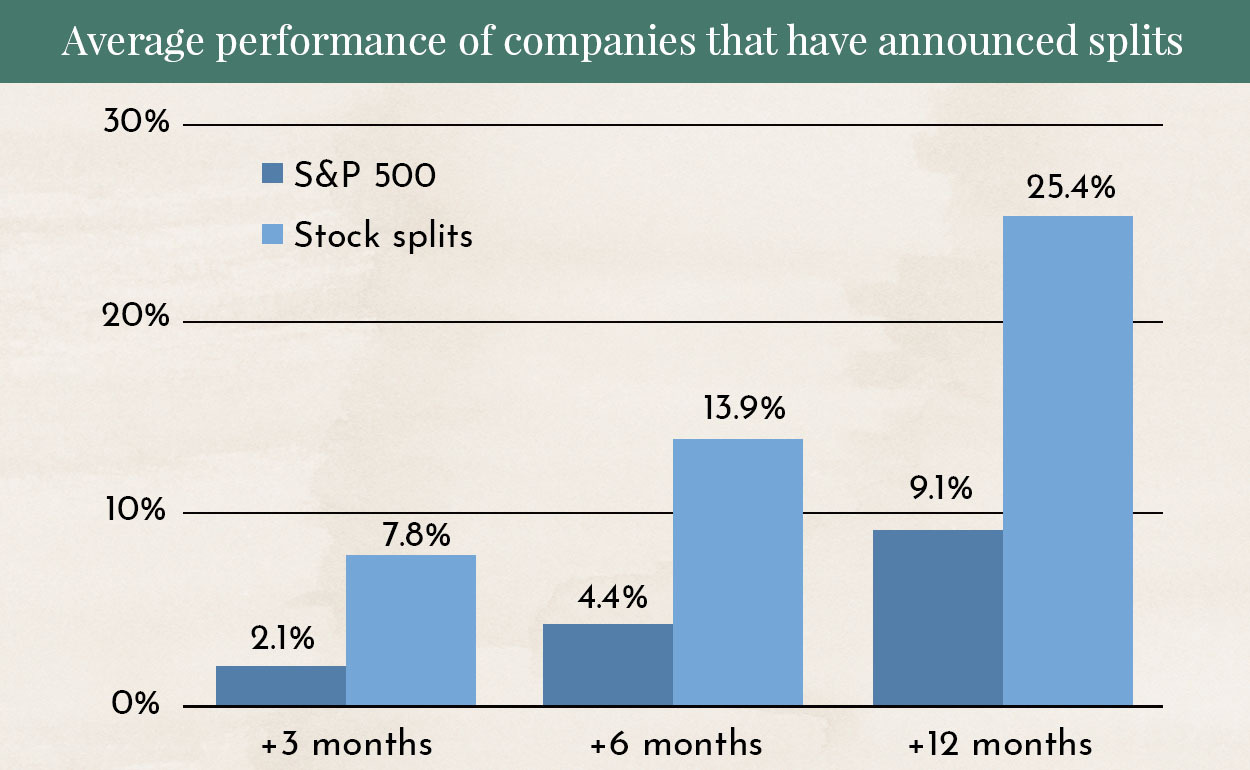
The chart shows the performance of stocks in the months following a split. As a rule, these stocks tend to generate significantly better returns than the overall market. Those who want to follow this topic further can check the stock split calendar of the Nasdaq to see which companies are carrying out a split.
Major Movements in the Bond Market.

The table shows that the majority of investors are now expecting 9 interest rate hikes by mid-2023. That is an all-time high. We also expect higher interest rates, but we consider 9 rate hikes to be excessively pessimistic.
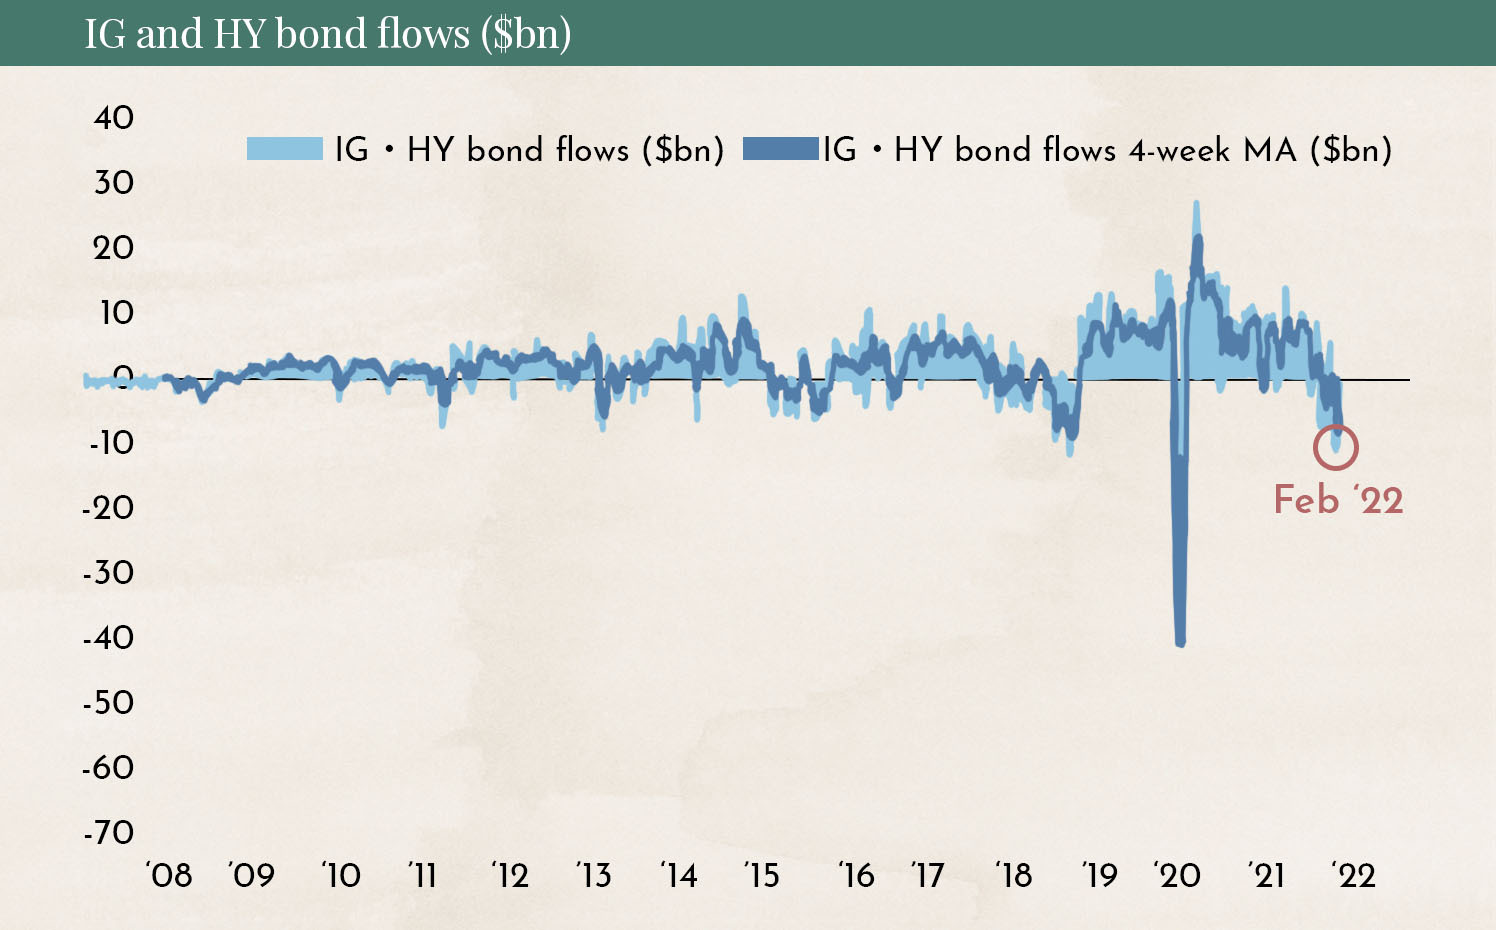
When interest rates rise, bonds tend to generate losses. It is therefore understandable that many investors are selling corporate bonds. The level of selling has reached a point rarely seen before. We also view this reaction as exaggerated, and in the short term, a rebound is likely. However, for long-term investors, bonds remain an investment we do not currently recommend.
What currently does not align with the major sell-off in the bond market are the money flows into TIPS (Treasury Inflation-Protected Securities):
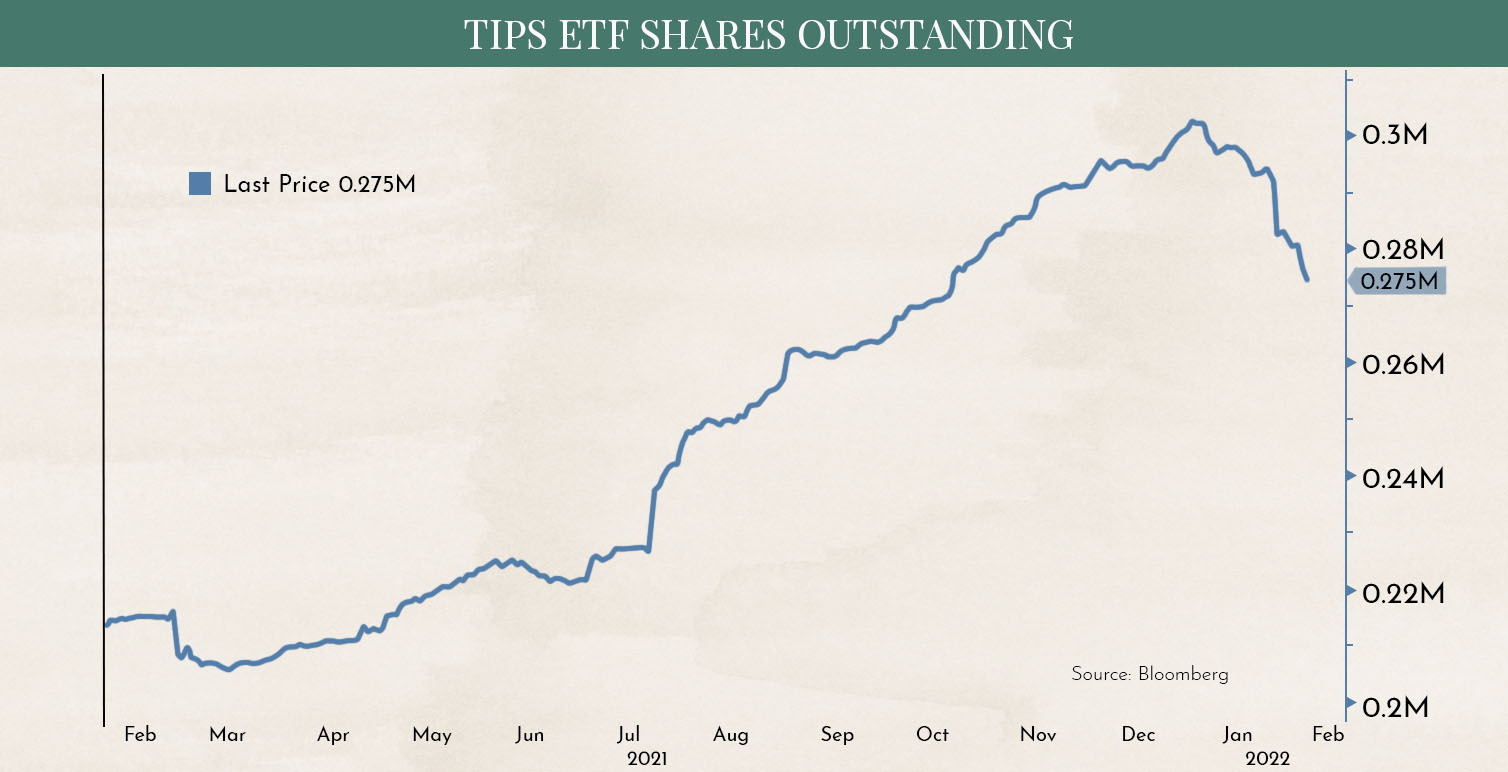
The chart shows that investors have been selling TIPS since mid-December. TIPS are inflation-protected government bonds. Most investors therefore seem to believe that inflation will not continue to rise. So why 9 interest rate hikes are still expected by mid-2023 is inconsistent.
We are also currently seeing a strong flattening of the yield curve. This means that the difference between short-term and long-term interest rates is decreasing.

The chart shows the spread between 2-year and 10-year U.S. Treasury bonds. A rising curve indicates a steeper yield curve, while a falling curve signals a flatter yield curve. At the moment, this is not yet alarming. However, if the curve were to turn negative, it would be an extremely negative sign. Historically, this has been the most reliable indicator of a recession. In every case where the curve turned negative and an inverted yield curve occurred, the economy slipped into a recession 6 to 12 months later.
Disclaimer:
The content in these blogs is intended solely for general information purposes and to help potential clients gain an understanding of how we work. It does not constitute recommendations to buy or sell assets and should not be considered investment advice. Marmot.Finance cannot assess whether or how the statements made align with your investment objectives and risk profile. If you make investment decisions based on this blog post, you do so entirely at your own risk and responsibility. Marmot.Finance cannot be held liable for any losses you may incur as a result of the information contained in this blog post. The products mentioned are not recommendations but are intended to demonstrate how Marmot.Finance works and selects such products. Marmot.Finance is also completely independent and does not earn compensation in any form from product providers.


.webp)





.jpeg)




.jpeg)

.svg)


