
Chart of the Week

The chart shows the price performance of the S&P 500 compared to earnings growth (Earnings per Share - EPS: earnings per share).
Why this matters:
A stock’s price is calculated by discounting all future earnings by the expected inflation rate. Political crises come and go, but the key driver of stock prices is corporate earnings. Over the past 1.5 years, the index has mostly traded above the line of expected earnings, reflecting hopes for positive surprises during earnings season. However, most market participants are currently pessimistic and expecting disappointments. If the earnings results and outlooks published over the coming weeks turn out to be not as bad as expected, this could provide the foundation for a strong upward move through Christmas (Santa Claus rally).
Mixed first-quarter earnings results
The first published earnings results for the third quarter of 2021 present a mixed picture. Banks (BlackRock and JPMorgan Chase) and SAP have impressed so far. Airlines (Delta Air Lines) and credit card companies have disappointed.

The chart shows the change in the Citibank Economic Surprise Index in the U.S., Europe, and China this year. The CESI is a widely followed index and has often predicted economic developments very accurately in the past. A value above zero indicates that market participants expect positive surprises in the publication of economic and corporate data. Currently, most market participants are expecting negative surprises. Historically, this has often been a good buying opportunity.
Inflation and growing concerns about a policy mistake by the U.S. Federal Reserve are keeping the bulls in check.
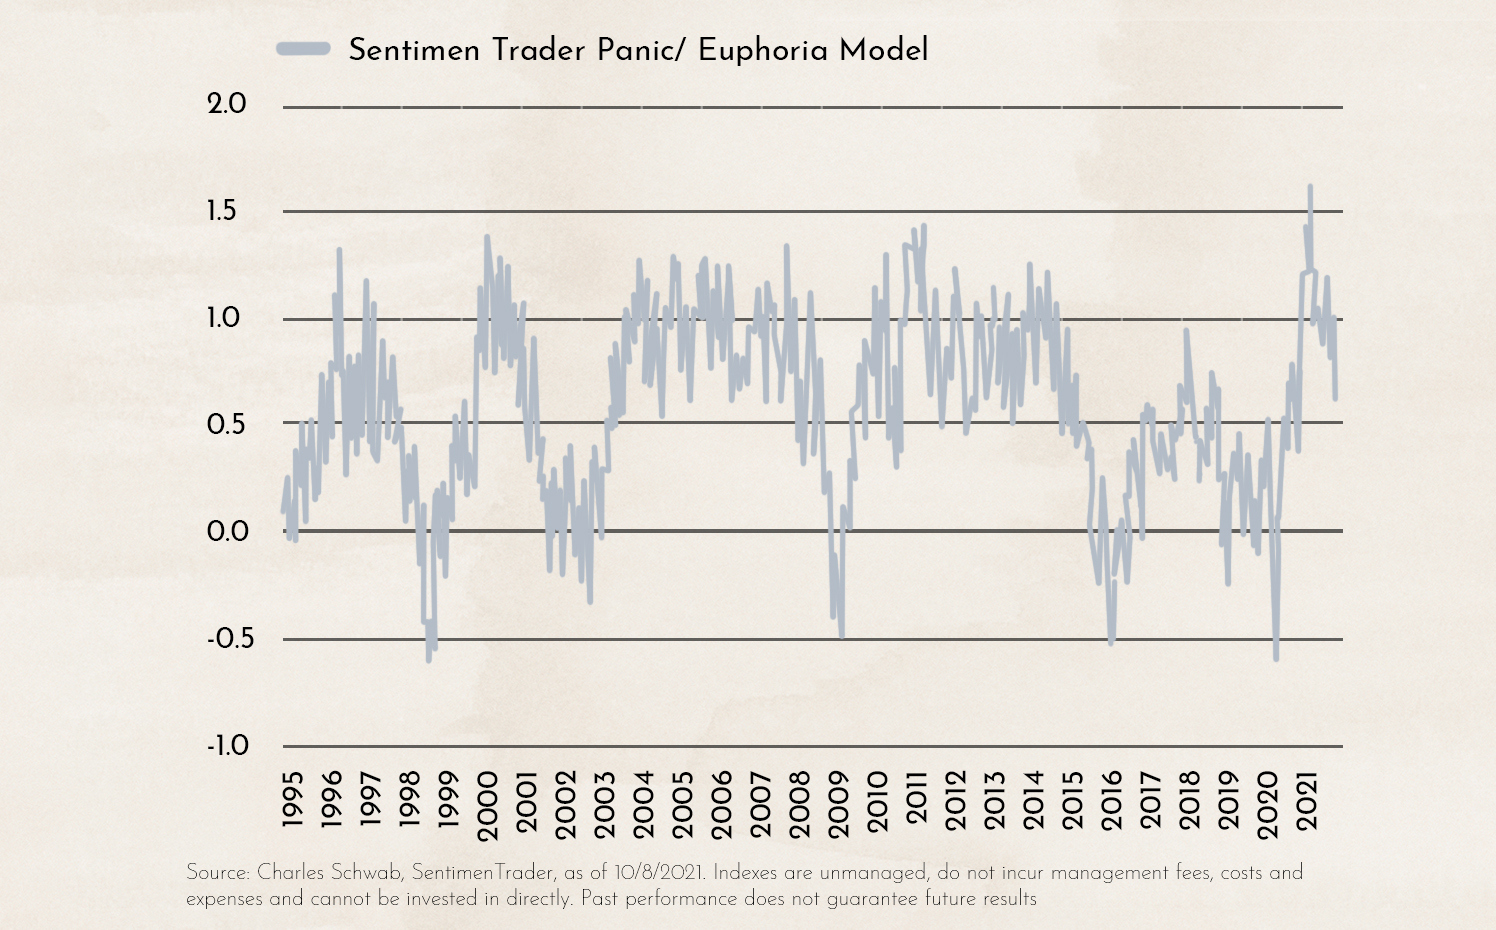
The chart shows the sentiment indicator calculated by U.S. broker Charles Schwab. The indicator is used as a contrarian signal, meaning a high reading that reflects euphoria is typically seen as a signal to sell. In recent weeks, that euphoria has cooled significantly.
This was mainly due to the fact that many market participants now expect two more interest rate hikes by the U.S. Federal Reserve later this year.
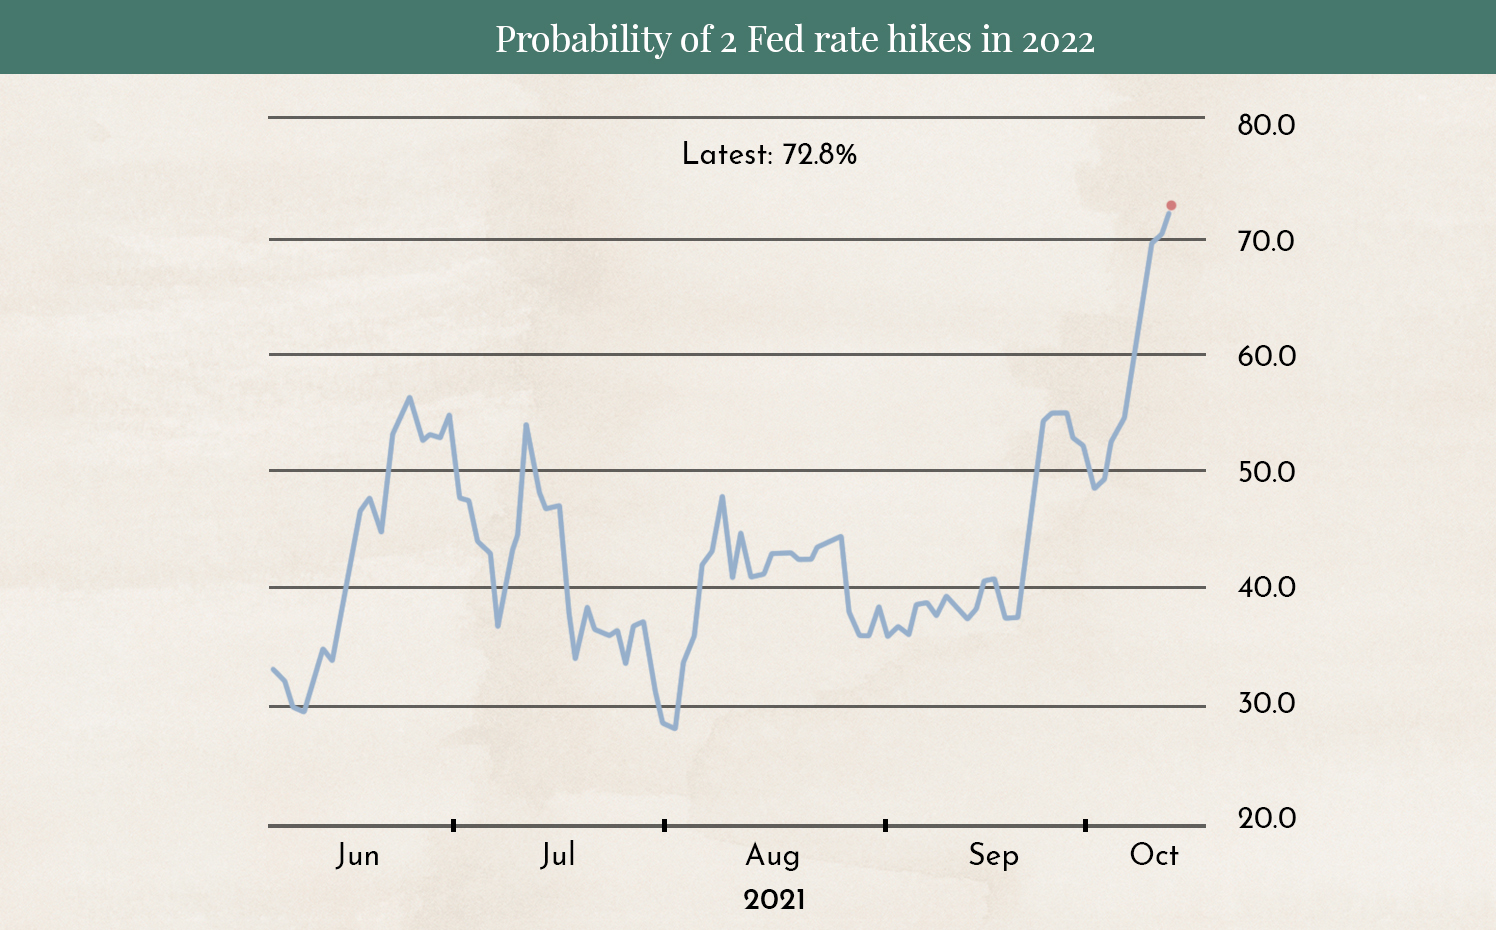
The chart shows the probability with which most market participants expect two more interest rate hikes by the U.S. Federal Reserve later this year. In July, the figure was still at 30%; now it is above 70%. Interest rate hikes are negative for stock markets.
The big question is whether the central banks are right, or whether further rate hikes will slow down an economy still weakened by the COVID crisis and lead to a recession.

U.S. bank JPMorgan Chase has calculated that inflation (blue and dashed line) will decline again even if the oil price rises to USD 100 and remains at that elevated level. This suggests that the central bank may be slowing the economy too aggressively this year.
Disclaimer:
The content in these blogs is intended solely for general informational purposes and to help potential clients gain an understanding of our way of working. It does not constitute recommendations to buy or sell assets and is not investment advice. Marmot.Finance cannot assess whether or how the statements made align with your investment objectives and risk profile. If you make investment decisions based on this blog post, you do so entirely at your own risk and responsibility. Marmot.Finance cannot be held liable for any losses you may incur as a result of the information contained in this blog post.
The products mentioned are not recommendations, but are intended to demonstrate how Marmot.Finance works and selects such products. In addition, Marmot.Finance is completely independent and does not earn any compensation from product providers in any form.


.webp)





.jpeg)




.jpeg)

.svg)


