
Chart of the Week

The chart shows the difference between the 10-year US Treasury yield and the 2-year US Treasury yield. Normally, short-term interest rates are lower than long-term interest rates. Since 1980, there have been four instances in which short-term interest rates were higher than long-term interest rates.
Why This Matters
When short-term interest rates are higher than long-term interest rates, this is referred to as an inverted yield curve. In the chart above, the grey shaded areas indicate periods of recession. Since 1980, inverted yield curves have been a clear leading indicator of recession within 6–12 months.
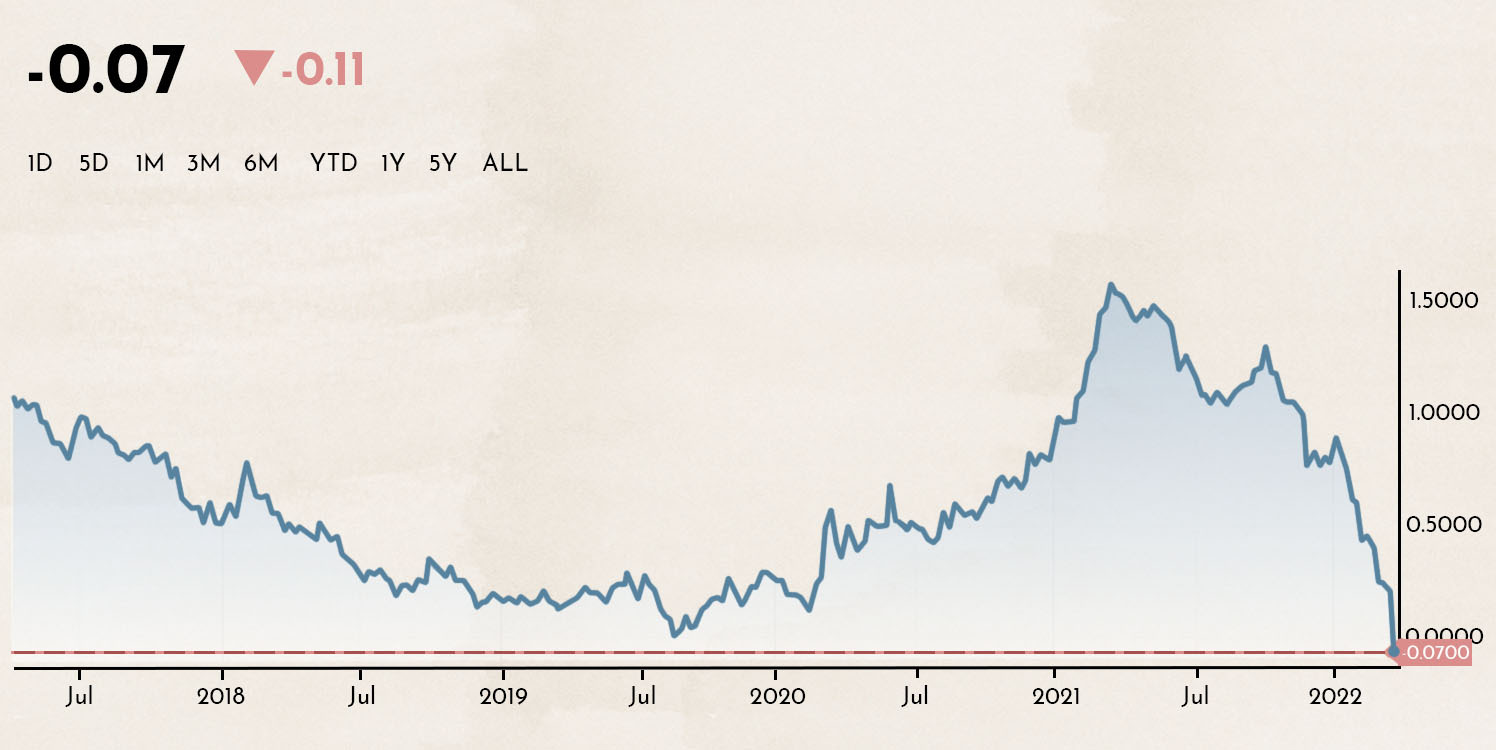
On Friday, the time had finally come. The yield curve turned inverted for the first time since the financial crisis (excluding the Covid shock).
Robust US Economy Triggers Panic in the Bond Markets
This movement in interest rates was triggered by very strong labor market data in the United States:

The US economy is running at full speed and performing significantly better than many had expected. The unemployment rate has already returned to pre-Covid pandemic levels.
It also appears that companies will report very strong results in the coming quarters:

The chart shows the expectations of the renowned investment bank Goldman Sachs for projected corporate earnings through the end of 2023.
As positive as these economic prospects may be, they are also a warning sign of trouble ahead. With near certainty, the US Federal Reserve will now have to continue raising interest rates aggressively. Strong corporate outlooks and low unemployment are likely to lead to higher wage growth and inflation. This development is already being priced into the bond market:

The chart shows the losses that bond investors in the US and Europe have suffered over the past year. These are the largest one-year losses for bond investors since 1949.
It is also remarkable that even though the European Central Bank has not yet raised interest rates, bond investors in Europe — particularly in Germany — have experienced similarly severe losses. Investors expect that Europe, too, will be unable to escape the trend of rising interest rates.

The chart shows inflation across individual EU countries. Inflation in the Eurozone is approaching 6% and continues to rise. Employee demands for wage increases are likely to put companies under pressure soon. It is reasonable to expect that a cycle of higher wages, price increases, rising inflation, and further wage growth may begin to take hold.
Side Note: How Is Inflation Calculated?
To calculate inflation, a hypothetical basket of goods is created, which should remain as consistent as possible over the years. The prices of each component are then recorded and compared with those from the previous year. This basket is composed as follows:

Those who would like a more detailed explanation can read more in a publication by the German Federal Statistical Office. It shows the impact that higher prices for items such as breakfast cereals or children’s socks have on inflation.

The chart shows the development of the individual categories of goods. With the exception of services, prices are rising broadly across the board. Due to both their weighting and extreme price increases, energy prices are having the greatest impact.
When looking at these charts and dynamics, it becomes clear why both the US and most European countries released part of their strategic energy reserves last week. The goal is to break the upward trend in energy prices in the hope of preventing an inflationary spiral from taking hold.
For investors, in such an environment, it is important to focus on companies with strong pricing power — those that can raise the prices of their goods and/or services. These companies can be found across all sectors, but are predominantly in the value segment, meaning established companies with strong fundamentals such as Nestlé or The Coca-Cola Company.
How Dangerous Is a Recession?
A recession is defined as negative growth in gross domestic product (GDP) over two consecutive quarters. According to this definition, we also experienced a brief recession last year, as GDP was negative in the second and third quarters of 2021 due to the Covid pandemic. Most people were probably not aware that the economy was in a recession in 2021.
A short and mild recession is therefore not particularly problematic. Currently, many analysts expect GDP to decline by around 0.1% to 0.2% in the second and third quarters of 2022. This would therefore not be especially severe.
However, a severe recession would be far more uncomfortable. Traditionally, central banks respond to a recession by lowering interest rates and increasing the money supply. Governments can also stimulate the economy through additional fiscal support programs. The following two charts show why this would currently be difficult:
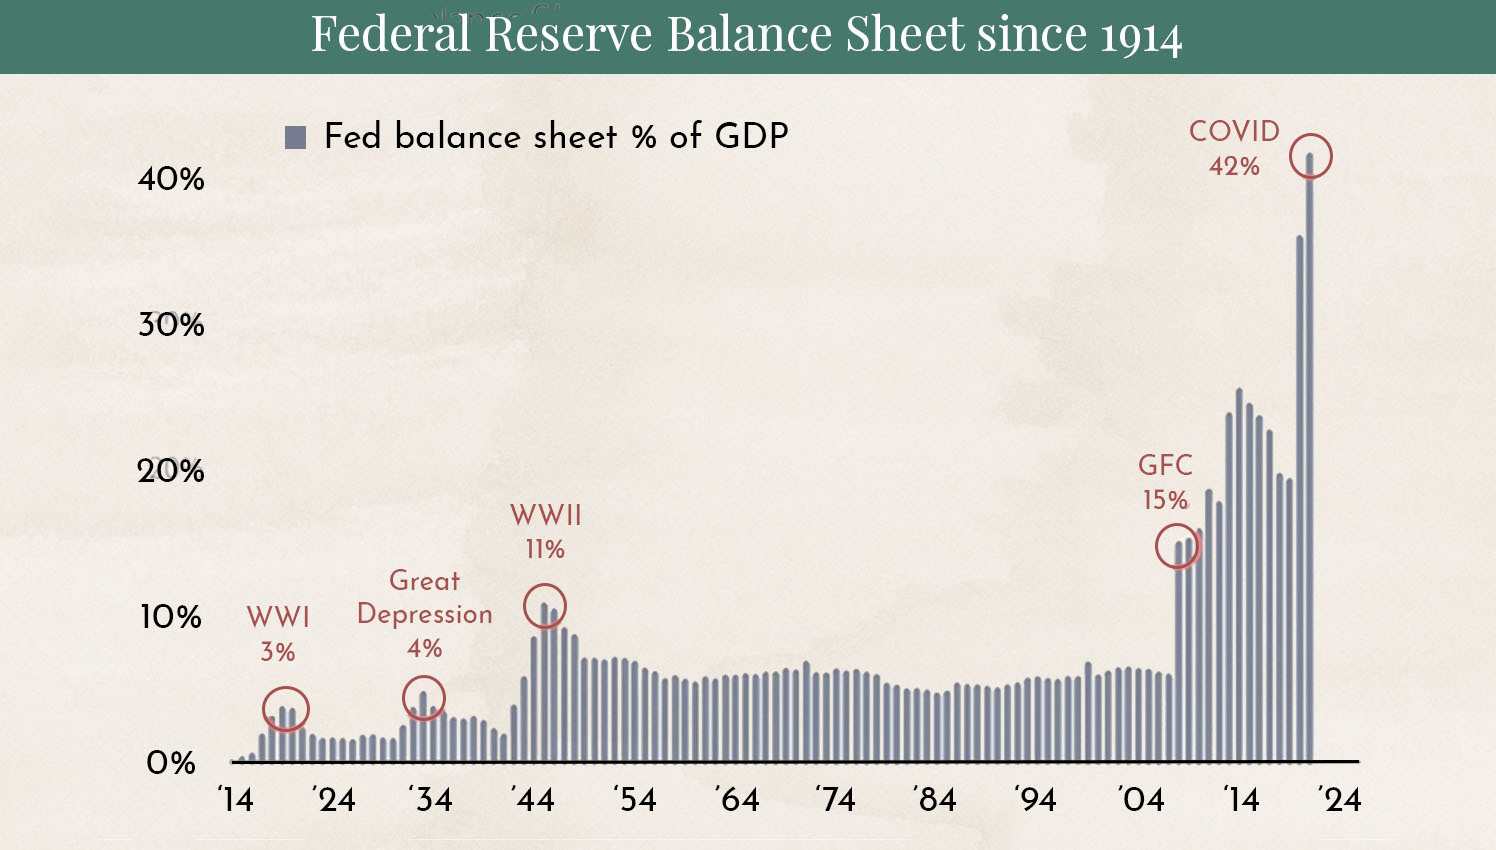
The chart shows how large central bank balance sheets currently are. Even after the First and Second World Wars, they were not this high. Central banks should now, in theory, be reducing the size of their balance sheets. If a severe recession follows, they may no longer have access to the traditional tools used to support the economy.

The chart shows US government debt relative to gross domestic product (GDP). The level of US government debt has also never been higher. This would limit the government’s ability to introduce additional economic stimulus programs.
This leaves us hoping that a severe recession can be avoided.
Disclaimer:
The content in these blogs is intended solely for general informational purposes and to help potential clients gain an understanding of how we work. It does not constitute recommendations to buy or sell assets and should not be considered investment advice. Marmot.Finance cannot assess whether or how the statements made align with your investment objectives or risk profile. If you make investment decisions based on this blog post, you do so entirely at your own risk and responsibility. Marmot.Finance cannot be held liable for any losses that may arise from the information contained in this blog post. The products mentioned are not recommendations but are intended to demonstrate how Marmot.Finance works and selects such products. Marmot.Finance is completely independent and does not earn compensation of any kind from product providers.


.webp)





.jpeg)




.jpeg)

.svg)


