
Chart of the Week

The chart illustrates the seasonality of S&P 500 returns. The bars represent the average monthly return since 1928.
Why This Matters
Investors often look to historical data as a guide for the future. In this context, April has been the second-strongest month for the stock market. Extra caution is often warranted in February, May, and September. These patterns also underpin the well-known market saying, “Sell in May and go away, but don’t forget to come back in October.” Historically, investors who stayed invested in the stock market from October to April, but remained out of the market from May to September, achieved significantly better returns than those who stayed invested year-round.
But be careful — these are average figures. Some of the strongest market rallies following the financial crisis and the COVID crash occurred between May and April.
Impact of Interest Rates on Currencies
Interest rate levels in a country have a significant impact on capital flows. Capital tends to move toward countries offering the highest interest rates. This is especially true among developed economies with similar risk profiles, such as the United States and Europe. Therefore, it is not surprising that the USD is currently strengthening against the EUR.

The chart shows how the USD behaved during the last 10 interest rate hiking cycles of the U.S. Federal Reserve. The “0” on the x-axis represents the date of the rate hike, with the 52 weeks before and after shown for comparison.
The first interest rate hike of the current cycle took place on March 15, 2022. Based on the chart above, the USD could continue to strengthen until mid-September.

The chart shows the investment bank Goldman Sachs’ forecast for the EUR/USD exchange rate. They also expect a weaker USD and, consequently, a stronger EUR starting in the autumn.
A key factor will be when the European Central Bank also begins raising interest rates. Only then will the EUR have a chance to strengthen against the USD.
Investments in Asia
An important question is how rising interest rates in the United States affect economies in Asia. Many Asian countries are closely tied to the USD, and the U.S. is also their primary export market.

The chart shows the performance of Asian stock markets (excluding Japan) during the last five U.S. interest rate hiking cycles since 1994. After the first rate hike, markets were still able to gain. However, once the U.S. economy begins to slow due to higher interest rates, Asian stock markets tend to suffer more than those in the United States.
Once the U.S. economy begins to weaken, it may also be time to sell stocks in Asia.
Earnings Season Begins Next Week
Next week, companies around the world will begin publishing their financial results for the first quarter of 2022. These figures will provide important signals for the future direction of the stock markets.
Traditionally, the banking sector is the first to report earnings.
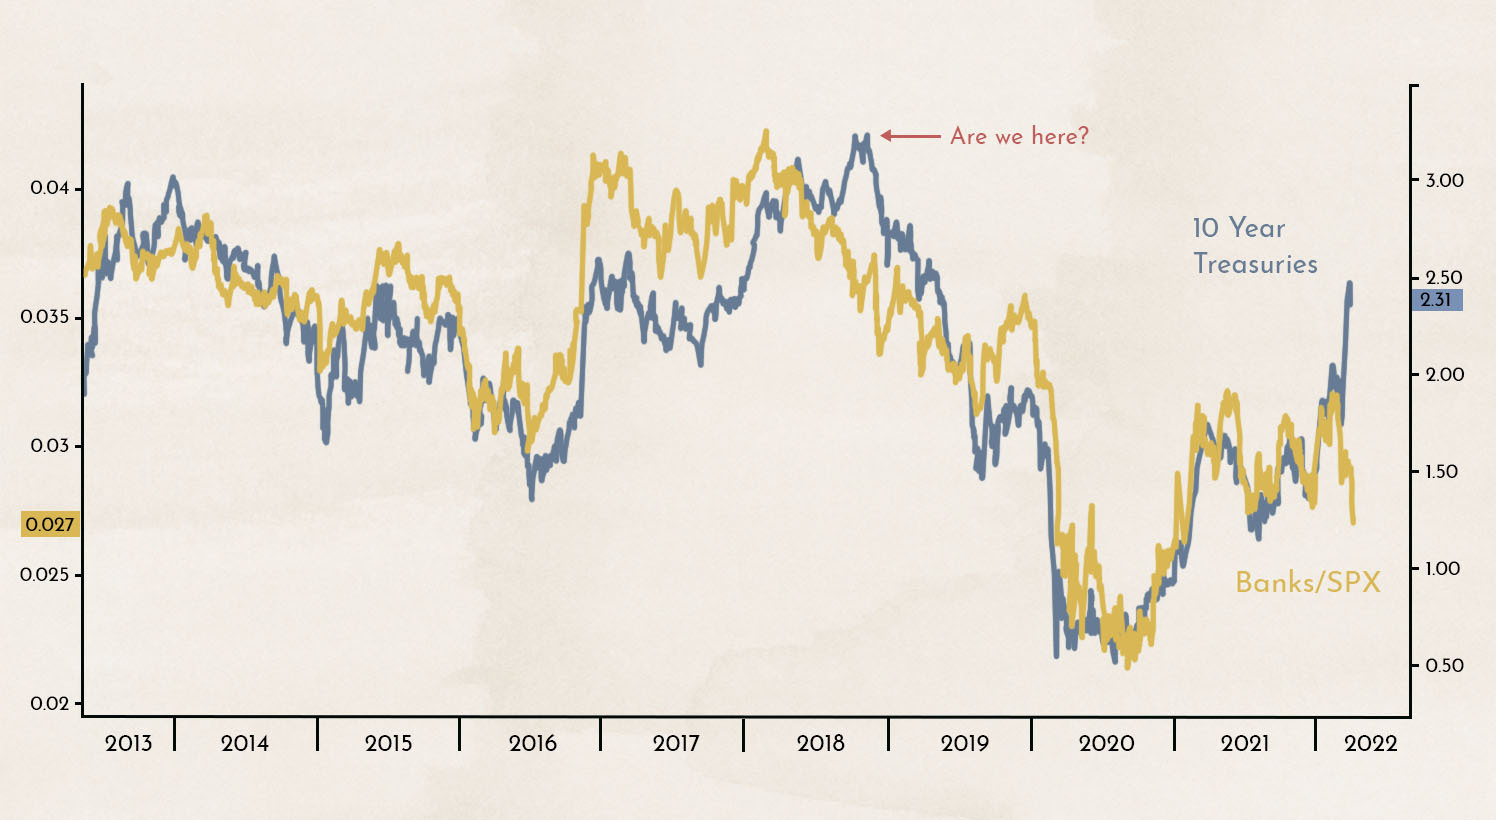
The chart shows that the banking sector is currently behaving in a highly unusual way. Normally, the performance of the U.S. banking sector closely tracks the movement of 10-year government bond yields. Over the past few weeks, however, this relationship has broken down. The last time there was such a strong divergence — or even an inverse market reaction — was in 2018. Interest rates have risen sharply in recent weeks, making some form of pullback likely. However, with another eight rate hikes planned through mid-2023, a significant decline in rates appears unlikely. Under these conditions, the outlook would generally support strong bank sector performance in the coming weeks. The release of first-quarter 2022 earnings results could act as the catalyst.
Disclaimer:
The content in these blogs is intended solely for general informational purposes and to help potential clients gain an understanding of how we work. It does not constitute recommendations to buy or sell assets and should not be considered investment advice. Marmot.Finance cannot assess whether or how the statements made align with your investment objectives or risk profile. If you make investment decisions based on this blog post, you do so entirely at your own risk and responsibility. Marmot.Finance cannot be held liable for any losses that may arise from the information contained in this blog post. The products mentioned are not recommendations but are intended to illustrate how Marmot.Finance works and selects such products. Marmot.Finance is fully independent and does not receive compensation in any form from product providers.


.webp)





.jpeg)




.jpeg)

.svg)


