
Chart of the Week
.jpeg)
The chart shows the extent to which the US Federal Reserve is supplying the economy with additional money. Since part of this liquidity flows into the stock market, growth in the M2 money supply generally has a positive impact on equity markets.
Why this matters
After the sharp increase in the money supply during the COVID period, the Federal Reserve reduced the money supply again in 2022 and 2023. A rising money supply acts like a safety net for equity markets. We are currently operating without that safety net, making markets more vulnerable to a correction than in previous years.
Strong year-end to 2023, but a difficult start to the new year.
Many people remember 2023 as a poor year for the stock market. War in Ukraine and the Gaza Strip, high inflation, climate change, etc. Market sentiment remained negative for most of the year.
Well, the numbers tell a different story. In local currency terms, stock markets in the United States gained 24%, Europe 18%, and Germany 20%. Switzerland performed somewhat less strongly with a gain of 4%, while China posted a decline of 4%. In most countries, however, returns were above the long-term average.
One downside, however, is that in the United States at least, index returns were driven predominantly by seven stocks (Alphabet (Google), Amazon, Apple, Meta (Facebook), Microsoft, Nvidia, and Tesla). Without these seven holdings in a portfolio, returns would have been only around 2–3%.
Further proof that one should not be overly influenced by the sentiment in the media and that having a long-term investment strategy is important.
A large share of the strong annual return came from gains in November and December. In December, the US Federal Reserve (Fed) was mainly responsible for the market rally. Following the December press conference, many investors interpreted the statements as signaling that the central bank expects interest rate cuts in 2024.
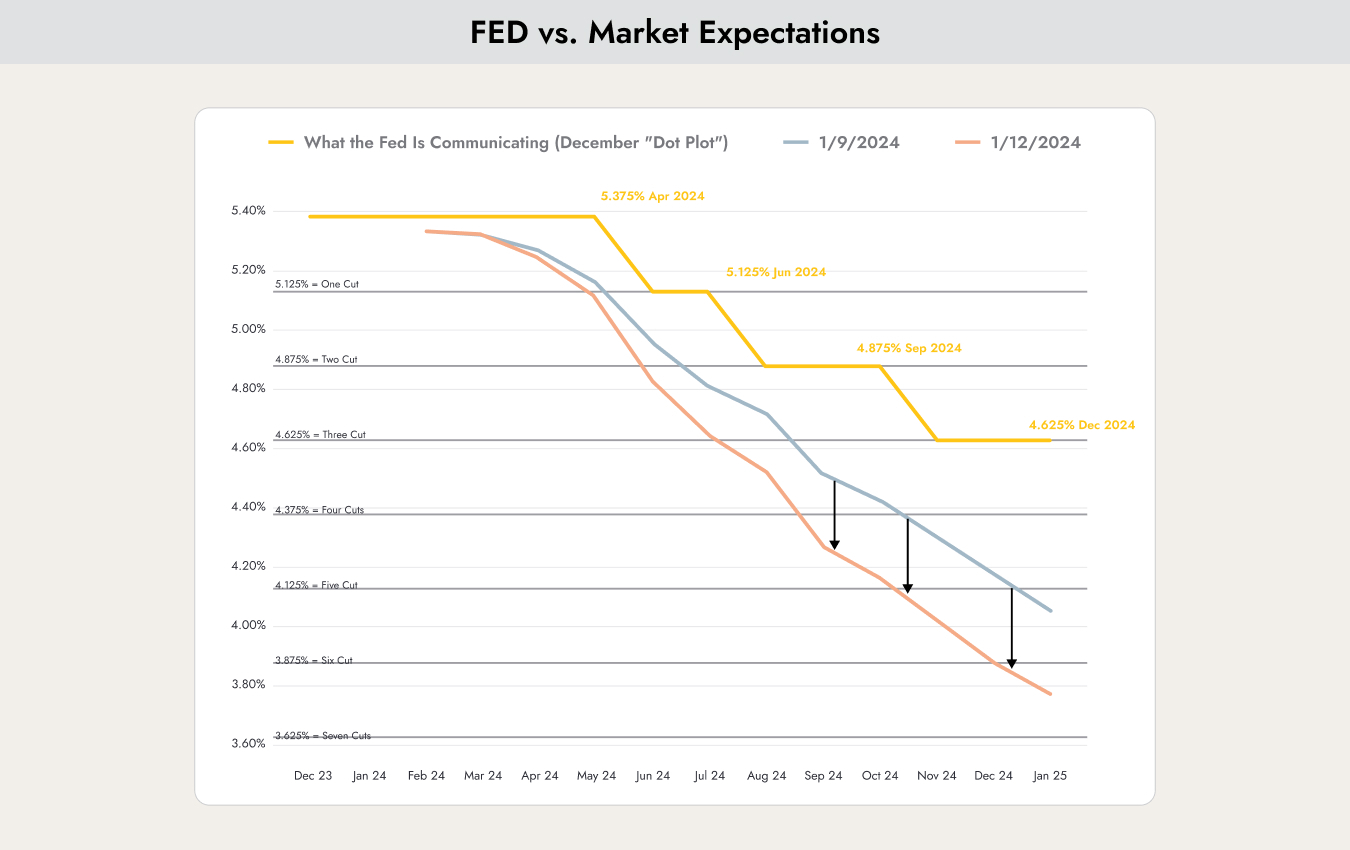
The chart shows the interest rate cuts expected by the voting members of the US Federal Reserve (yellow), as well as the rate cuts expected by the market on January 9, 2024 (blue) and January 12, 2024 (red).
The market is currently pricing in up to six interest rate cuts in 2024.
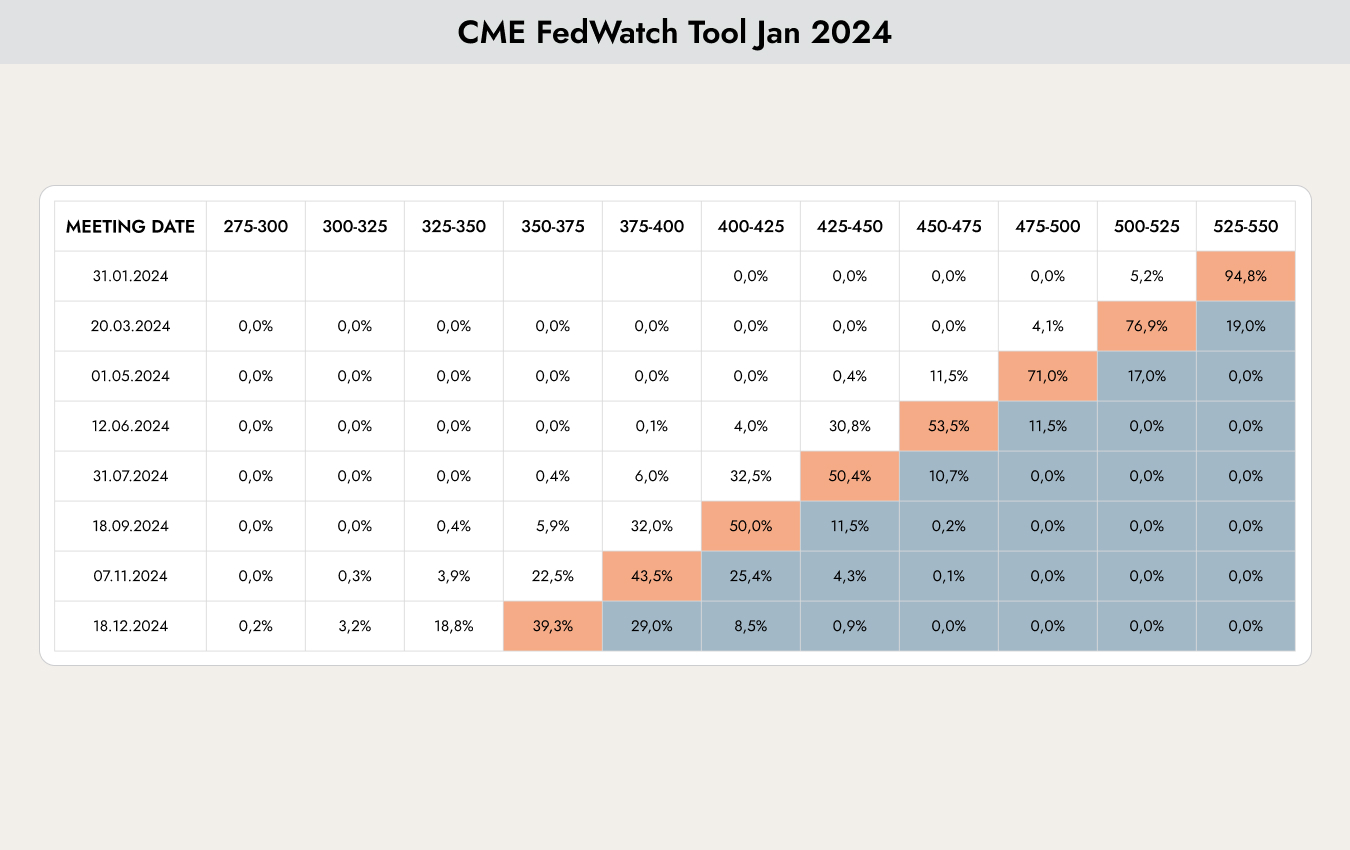
As the chart shows, the market expects an interest rate cut at every US Federal Reserve meeting starting in March 2024.
However, one should be careful what one wishes for. Central banks are tasked with keeping the economy in balance. Inflation should be around 2%, and unemployment should not be too low. If the economy is in balance, central banks are unlikely to change their policies. Therefore, wishing for one or even six rate cuts implies expecting that equilibrium to break. Six rate cuts would only be possible if economic and corporate conditions deteriorated significantly or if deflation became a threat — both scenarios that investors would generally prefer to avoid.
Fundamentally, not much has changed compared to 2023. Long-term economic indicators continue to signal a coming recession, yet economic growth figures and corporate earnings remain positive. The tug-of-war between these two fundamentally opposing views continues.
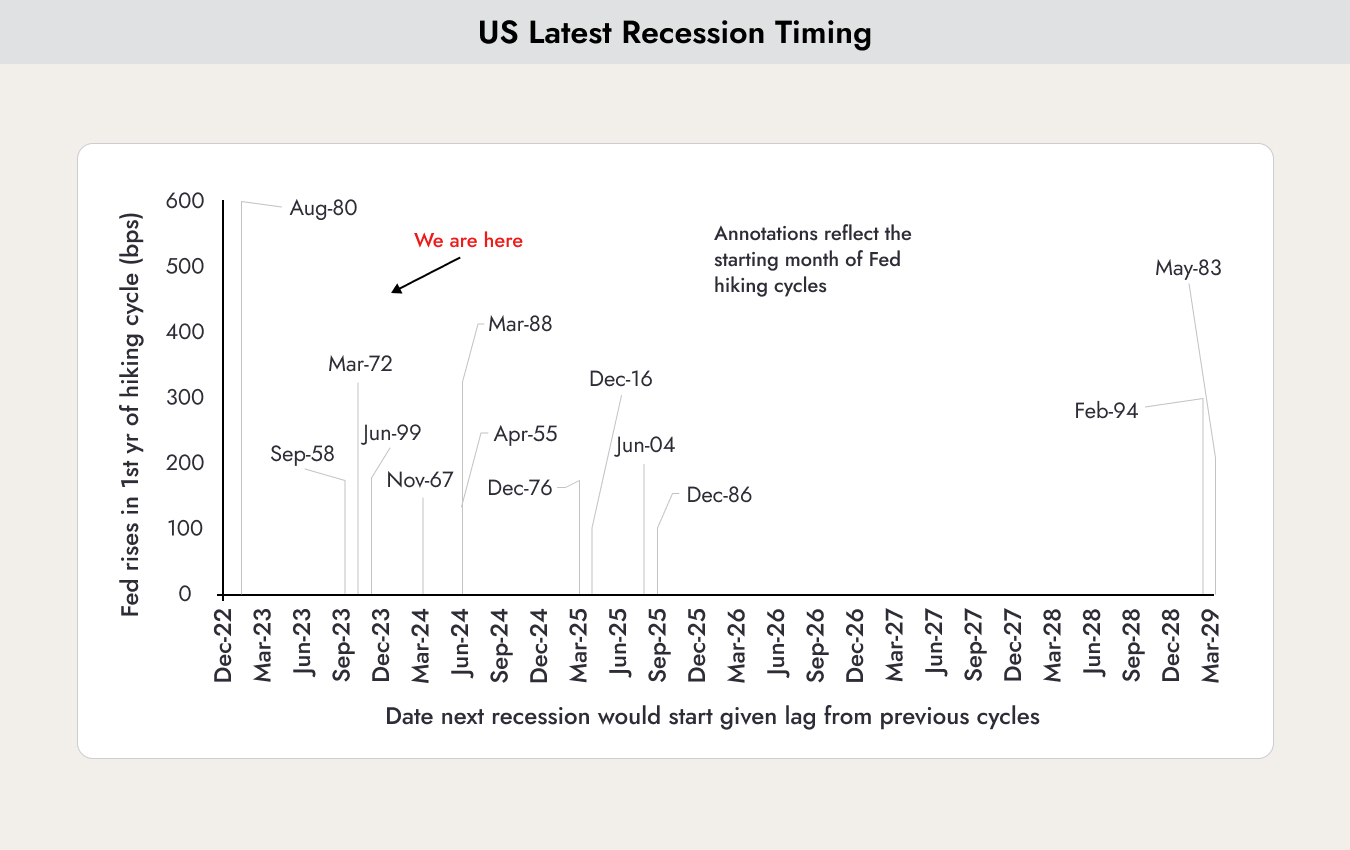
The chart shows US recession and Federal Reserve cycles. There is typically a time lag between the first interest rate hike and a potential recession. The chart illustrates when, based on the first rate hike at the end of 2021, a recession would have begun during the previous 13 cycles.
It is often argued that the risk of a recession has passed because it should have already occurred by now. That is not correct. As the chart shows, a recession beginning in 2024 would be in line with the average timing of past recessions.
Even though current expectations for interest rate cuts are likely exaggerated, we are not in the bearish camp.

What continues to give us confidence is the outlook for companies. Rising corporate earnings are still expected for both 2024 and 2025. The chart above shows projected corporate earnings. These forecasts are typically optimistic at the beginning of the year and are then revised slightly downward. Even so, earnings in the fourth quarter of 2023 are not expected to be lower than in the third quarter of 2023.
The stock market has had a sluggish start to the new year, but after the record rally in November and December 2023, this is not surprising.
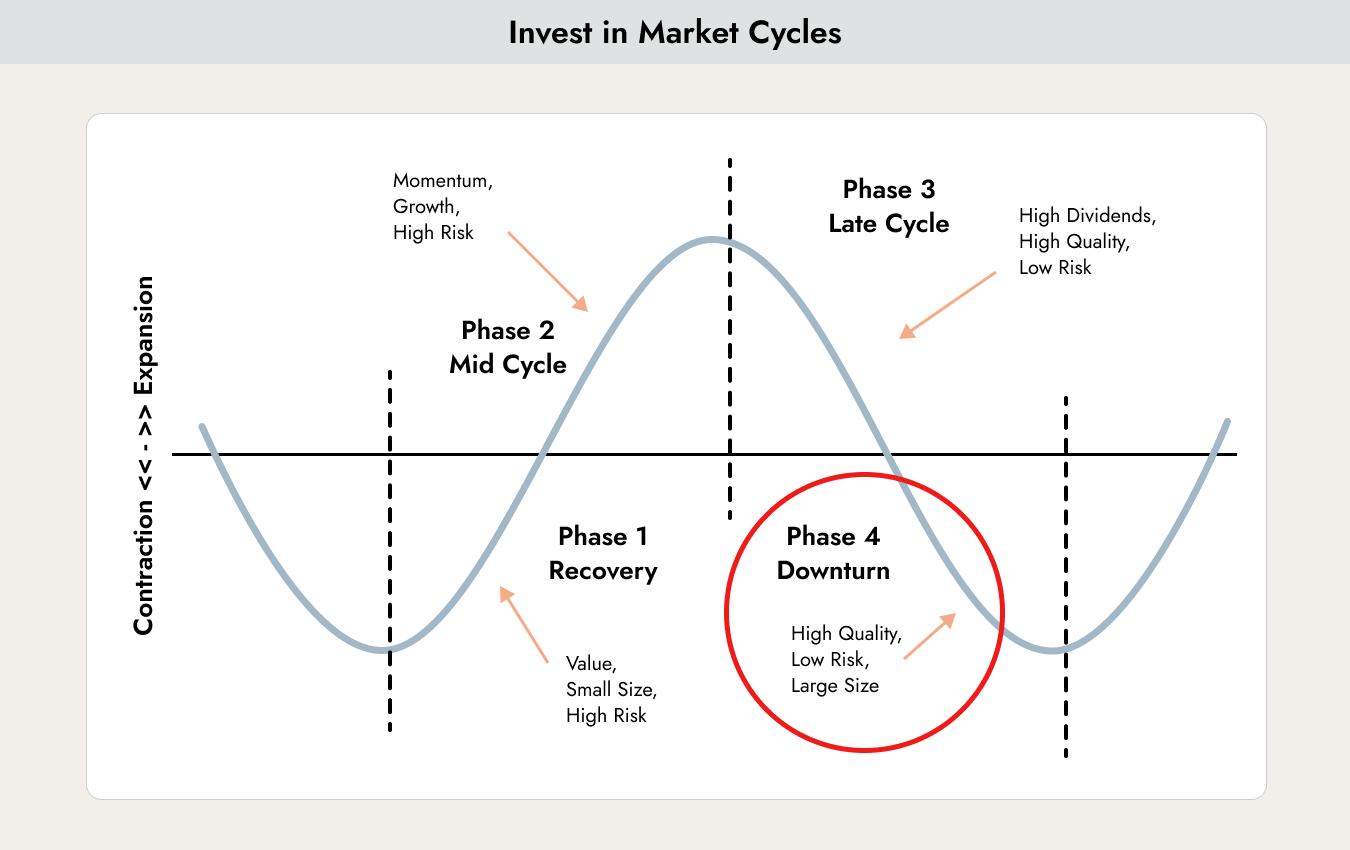
Based on our long-term cycle model, we still see ourselves in phase four. Following the first interest rate cut, we would then move into phase one. However, it is still too early for that at this stage.
Bitcoin is becoming mainstream.
This week, the first spot ETFs were finally approved by the US financial regulator. US investors can now integrate Bitcoin into their asset allocation easily and without having to open accounts in the Cayman Islands.
We refer here to the market report from November 13, in which we discussed the positive implications of this development. Since speculation around the approval intensified, Bitcoin has already gained more than 80%. Since the date of the November 13 market report, it has risen by 35%.
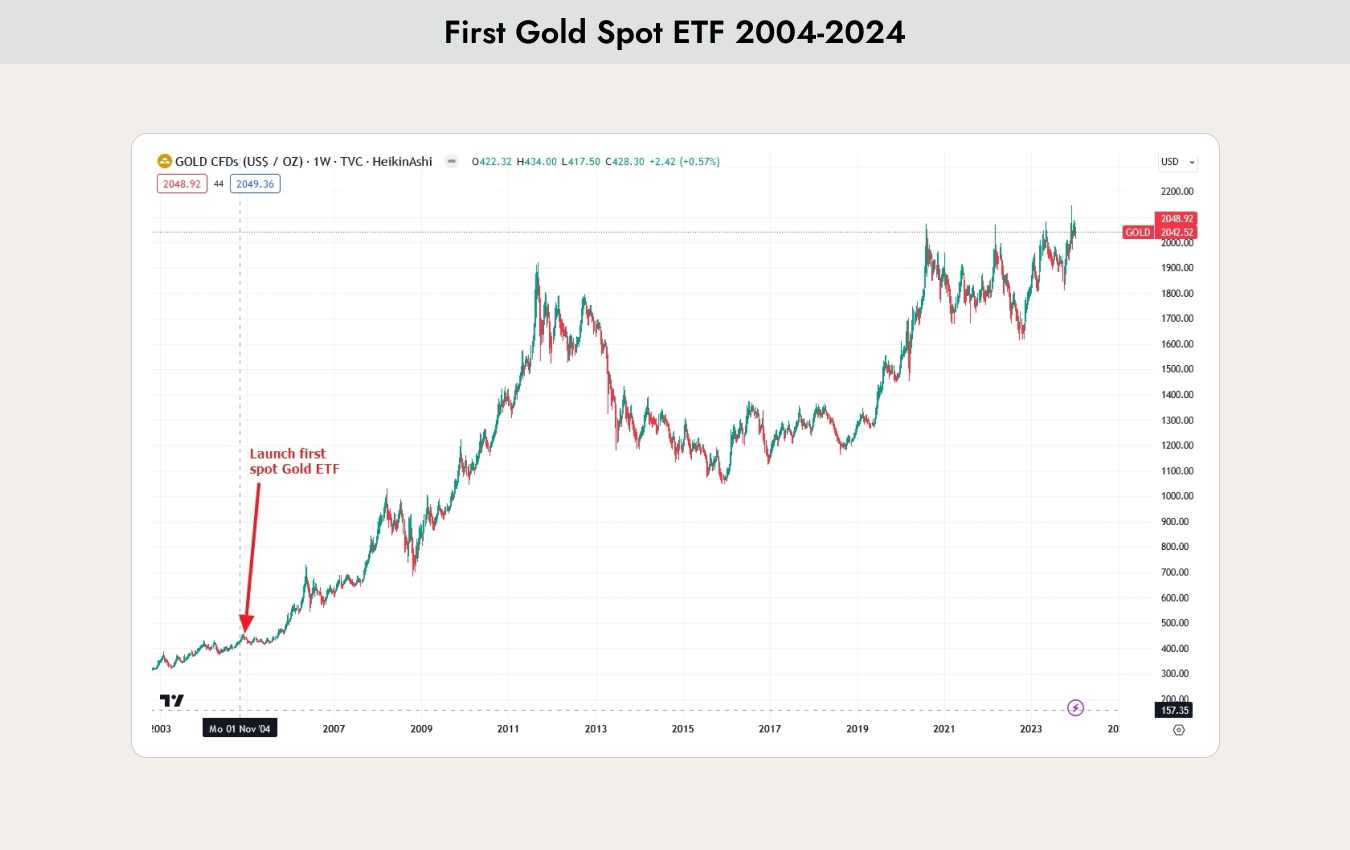
The chart shows how the price of gold developed after the launch of the first spot ETF for gold. Over the following 10 years, the price increased by 350%.
The increase in Bitcoin could be even greater, as the supply is limited and can only grow marginally.
In the first week, up to USD 5 billion was invested in the new spot ETFs. This is a remarkable figure and likely broke several records. However, the providers may have been somewhat overly optimistic. As OTC (over-the-counter) transactions indicate, providers appear to have allocated up to USD 30 billion worth of Bitcoin. In the coming weeks, they will likely reduce these holdings again, which could put downward pressure on the price.
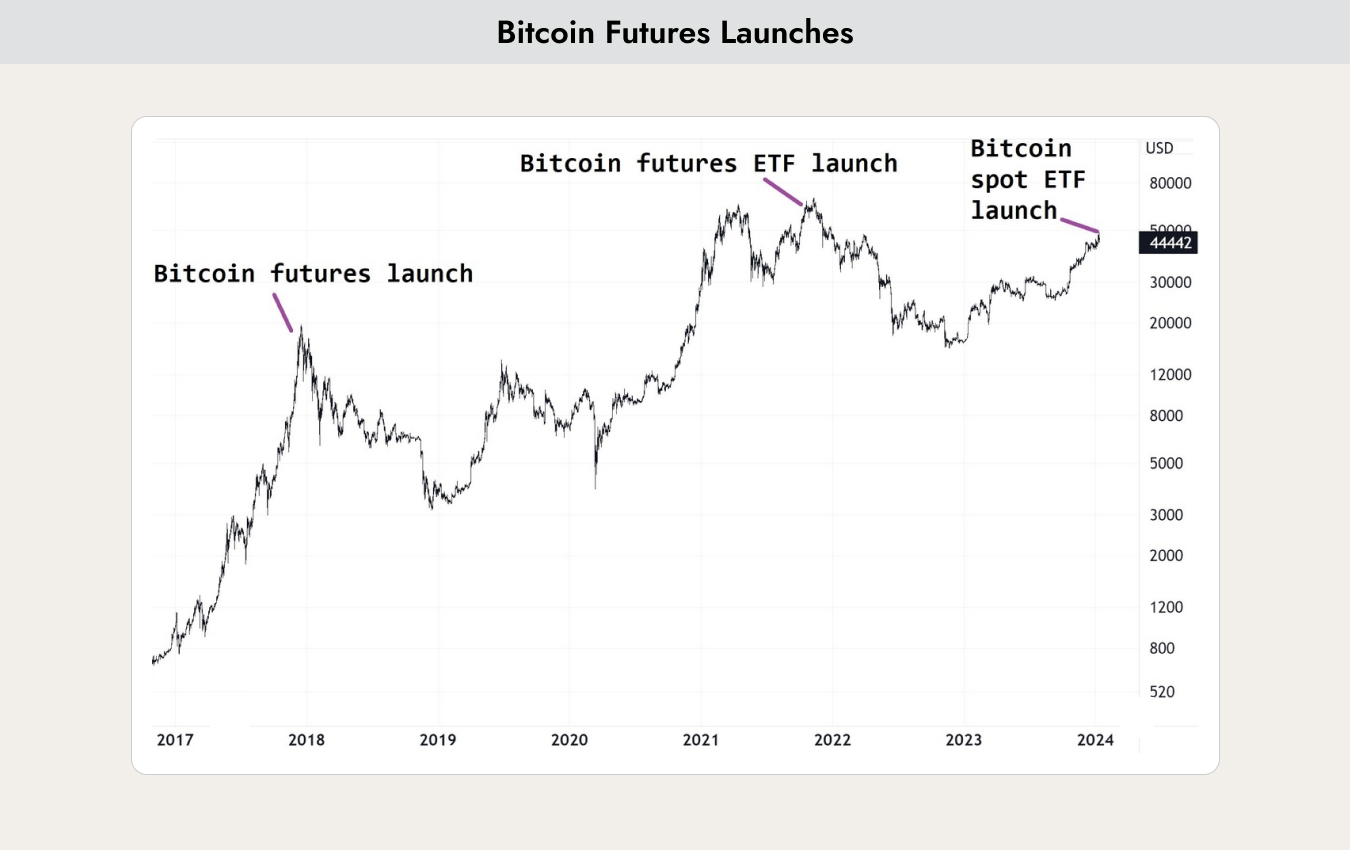
The chart shows Bitcoin’s price reaction following the launch of the first futures contracts and futures ETFs. However, it should be noted that both futures launches shown occurred after the end of a halving cycle. (We also covered the halving in detail in the market report from November 13.)
We believe that the momentum has now faded and that a consolidation phase lasting several weeks is likely. Probably not much longer, however, due to the positive effects expected from the halving in April 2024.
But be careful: Bitcoin’s volatility is likely to remain high and therefore is not suitable for all investors. Price increases of 50% are not uncommon, but neither are declines of 50–60% over a short period of time.


.webp)





.jpeg)




.jpeg)

.svg)


