
Chart of the Week

The chart shows the change in home prices for newly built houses in the United States. In red, the development during the financial crisis that originated in the housing market, and in blue, the development in 2023 and 2024.
Why This Matters
The crisis in the real estate market is still ongoing. It is now comparable to the financial crisis in the United States from 2008 to 2010. So far, the financial markets have absorbed the decline relatively well. The crisis has not yet spread to other sectors of the economy. This is likely due to the low unemployment rate.
There is a well-known stock market rule: “Never catch a falling knife.” You should not try to catch a falling knife while it is still in motion. It is better to wait until it has hit the ground and then pick it up safely. The same applies to investments in the US housing market — it is better to wait until the downward momentum slows and signs of price stabilization become visible.
Systematic Decision-Making Errors
Last week, Nobel Prize-winning economist Daniel Kahneman passed away. His main field of research was the psychology of judgment and decision-making.
For a long time, economists assumed that all market participants acted purely rationally. Daniel Kahneman demonstrated that this was not the case.
He wrote many books on this topic that are highly educational for investors. Here is a list of the systematic decision-making errors that many investors make.
- Loss Aversion: People tend to fear losses more strongly than they value gains. For example, investors may hold on to stocks longer in order to avoid realizing a loss, even when it would be rational to sell and limit potential further losses.
- Confirmation Bias: This occurs when people favor information that confirms their existing beliefs or hypotheses and tend to ignore information that contradicts them. For example, individuals who believe that certain dietary supplements provide health benefits may ignore studies showing the opposite.
- Overoptimism: People tend to overestimate the likelihood of positive events and underestimate the likelihood of negative events. For example, entrepreneurs may assess the chances of success for their new business too optimistically while neglecting potential risks.
- Attribution Bias: People tend to attribute their own successes to internal factors, such as their skills or efforts, while attributing failures to external factors, such as bad luck or unfavorable circumstances. For example, athletes may credit their victories to their training while blaming losses on external influences such as poor weather conditions.
- Hindsight Bias (Retrospective Bias): People tend to view past events as predictable or inevitable after they have already occurred. This can lead to an overestimation of one’s own ability to predict events. For example, after a stock market crash, investors may believe they could have foreseen the decline, even though this is often not the case.
- Groupthink (Conformity Bias): In group decision-making, the desire for consensus and harmony can lead members to withhold their own concerns or differing opinions in order to maintain group cohesion. This can result in poor decisions because important information or alternative perspectives are not taken into account.
Source: ChatGPT, 29.03.2024
It is worthwhile to read through this list regularly and ask yourself whether and when you may have made these mistakes as well. Should I really not sell the stock in my portfolio that is showing a loss? Is the stock in my portfolio that is generating a profit truly that good, or am I just convincing myself that it is?
A somewhat more complex example is the confusion of cause and effect.
A 19th-century English reformer observed that farmers who were moderate and hardworking in all aspects of life owned at least one or two cows. Those who owned none were generally lazy and prone to drunkenness.
"He therefore proposed giving a cow to all farmers who did not yet own one in order to make them more moderate and hardworking in all aspects of life."(Source: Risk Management, Christian Glaser, page 326).
In the example above, the flawed conclusion is very obvious. In the next example, however, it is a bit more difficult to recognize.
US National Debt
Immigration and the national debt will likely be the main issues in the election campaign in the United States.
The development of the national debt in the United States does indeed appear concerning:

The chart shows the level of national debt in the United States. Major crises have generally led to sharp increases in debt levels — including after the pandemic.
Unlike in previous cases, however, the debt level — shown here in relation to gross domestic product — is not declining. These projections do not come from some pessimist, but from the Congressional Budget Office.
The Congressional Budget Office was founded in 1974. It is a nonpartisan agency of Congress that calculates the additional debt resulting from newly proposed legislation. Its figures are accepted by both Democrats and Republicans.
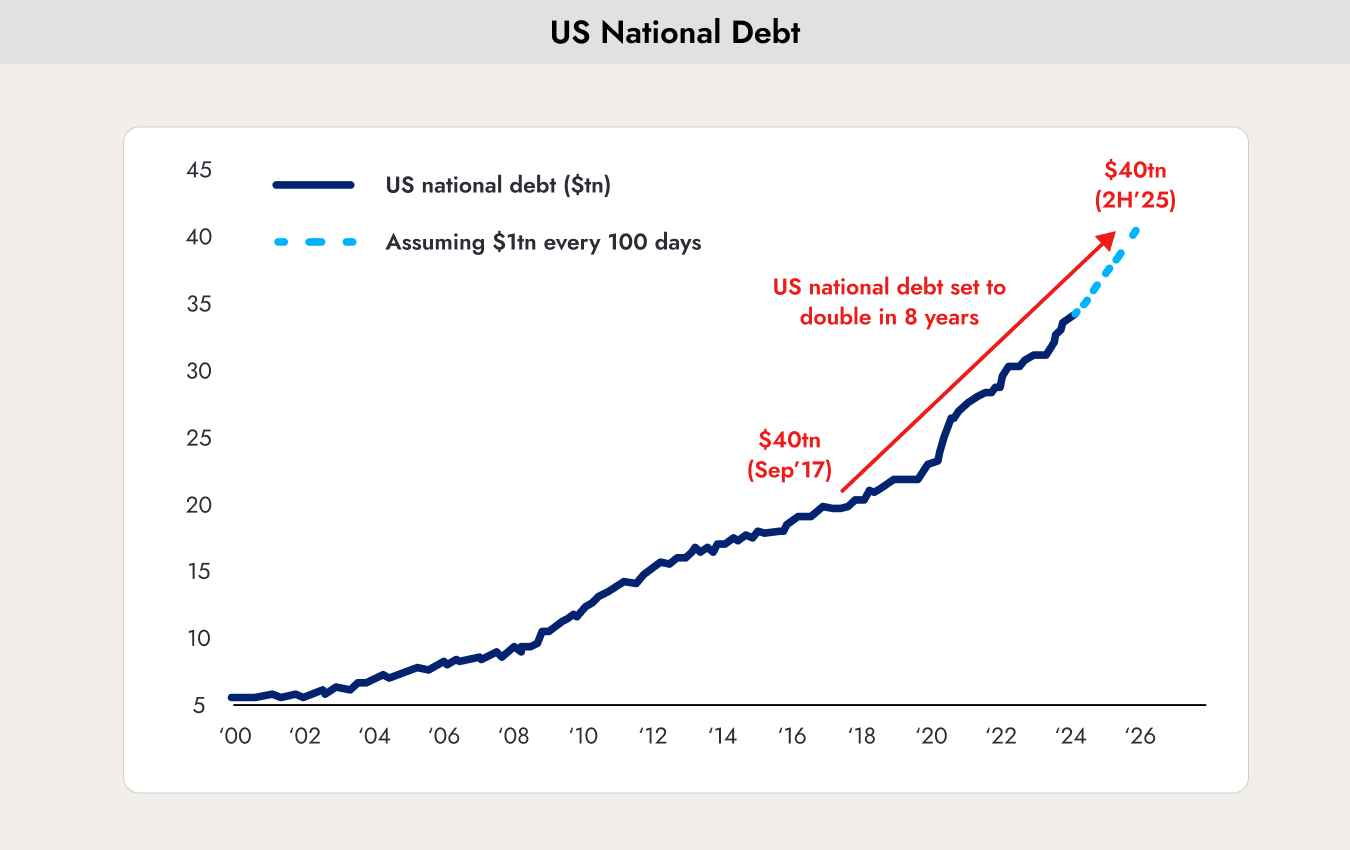
Based on estimates by the Congressional Budget Office, US national debt is expected to double from 20 trillion to 40 trillion dollars between 2017 and 2025.
A unique feature in the United States is the debt ceiling, which is set by Congress. Once this limit is reached, the parties must agree on raising it; otherwise, the United States could face a government default because interest payments on existing debt could no longer be made.
In 2023, the parties agreed to suspend the debt ceiling for two years — until after the elections. In return, the Democrats had to significantly limit government spending.
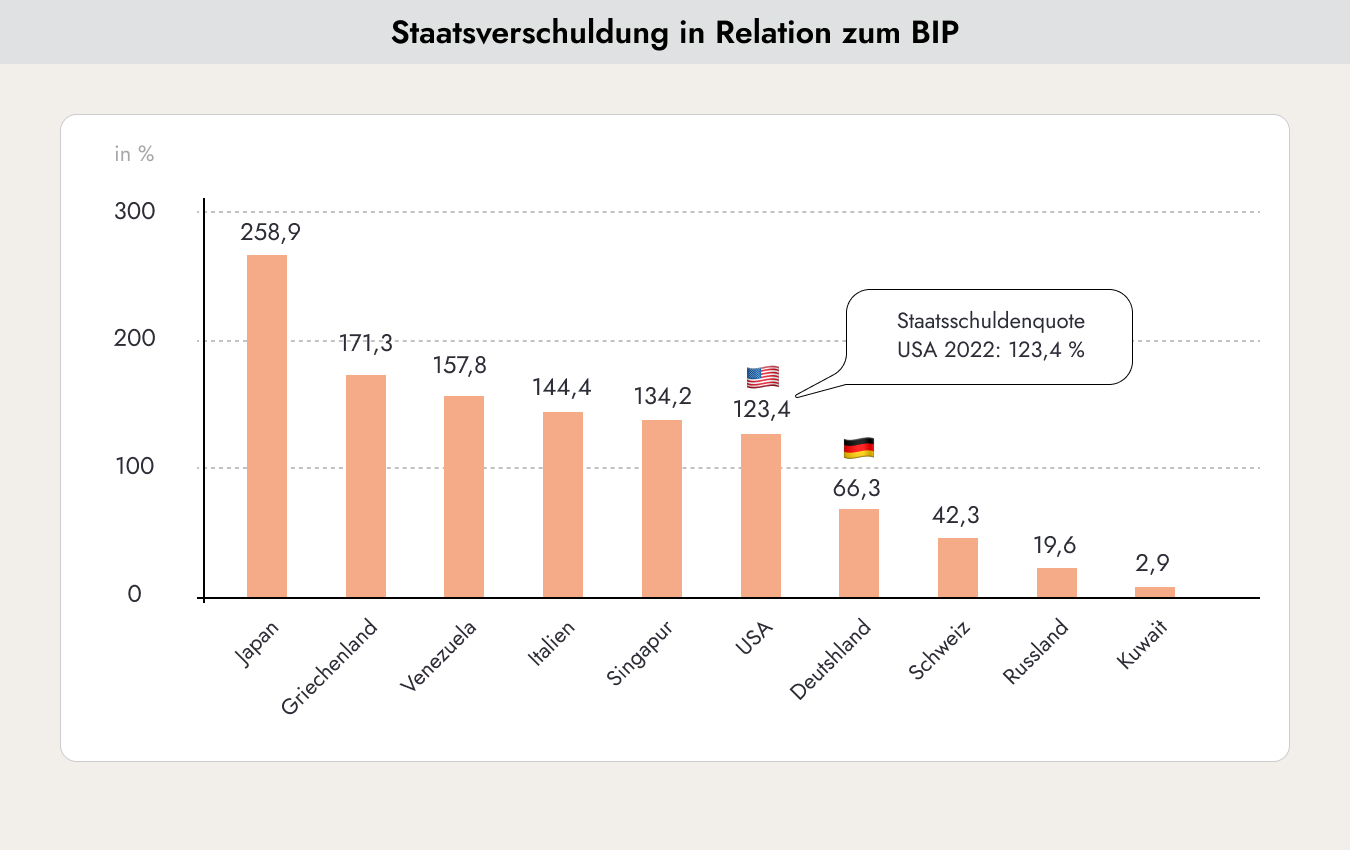
For a private individual, debt is measured in relation to annual income. For countries, the equivalent of annual income is gross domestic product (GDP). This is illustrated in the chart above.
This raises the question of what level is considered too high. That is not so easy to answer. Japan has maintained a debt level of over 200% of GDP for years and has nevertheless managed relatively well. Greece, on the other hand, had to declare sovereign default with a debt level of around 170%.
The optimists — primarily the Democrats — argue that a sovereign default by the United States is impossible, or at least still very far away, given that the US dollar remains the world’s reserve currency. The pessimists — especially the hardline supporters around Donald Trump — argue that the United States is on the verge of bankruptcy.
It is not only the level of debt that matters, but also which investors hold the debt and the price they demand for it — in other words, the interest rate.

The chart shows which countries are financing the national debt of the United States. The three largest holders of US government securities are Japan, China, and the United Kingdom. All three countries have reduced their holdings in recent years because they have had to address many domestic challenges.
As we saw earlier, the supply of US government bonds is rising sharply, while demand is tending to decline. In markets, this is never a good sign. In the current case, it means that the United States will likely have to pay higher interest rates to persuade investors to finance its large deficit.
However, the largest holder of US government bonds is missing from the chart above. Currently, this creditor owns close to 50% of all US government bonds. This creditor is the US central bank, the Federal Reserve. In large part, the government is financing itself by creating money to fund its deficit.
An important factor is also the level of interest rates. In Japan, key interest rates have remained between 0% and 1% for more than 20 years. This makes it much easier to manage a high level of government debt.
The United States currently pays an average interest rate of 3% on all outstanding government bonds. However, all bonds that mature, as well as all newly issued bonds, must now be issued at an interest rate of around 5%. This is leading to a sharp increase in interest payments.
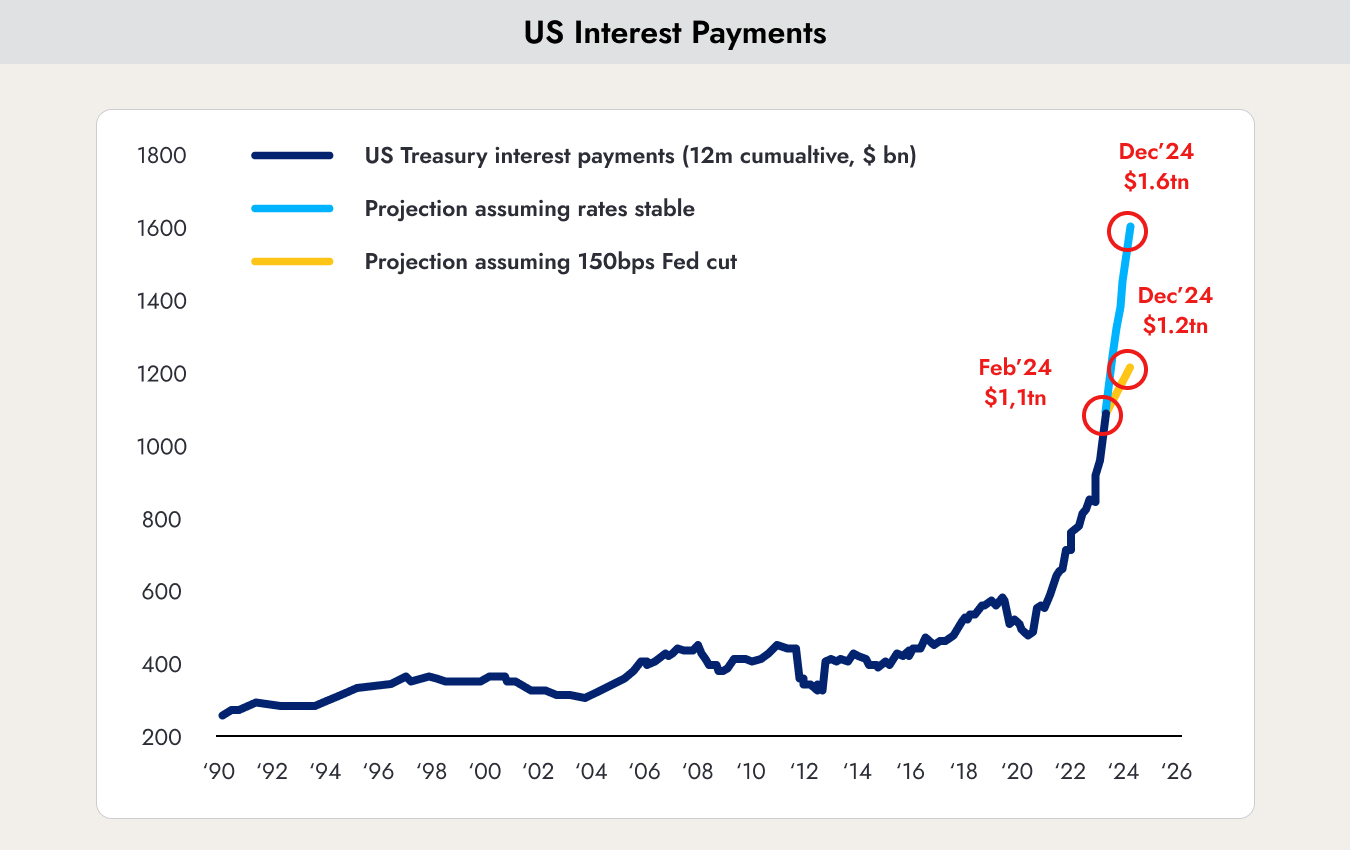
The chart shows the development of interest payments by the US government. Due to the sharply rising interest rates, these payments have also surged dramatically. Currently, the United States needs around 10% of all tax revenues just to pay interest on its debt. If interest rates remain at current levels, this figure will continue to rise rapidly, reducing the government’s ability to finance public programs — including the military.
The chart highlights in yellow how the interest burden would develop if the Federal Reserve were to cut interest rates in June.
The key question is how independent the central bank can still remain. If it does not raise interest rates, it risks triggering a crisis in the US government bond market — of which the Federal Reserve itself holds around 50%.
At the moment, this is still not considered a major issue. The prevailing view is that the United States cannot go bankrupt as long as the US dollar remains the world’s reserve currency. At the same time, however, the topic has largely been ignored. During the election campaign, it is now being pushed to the very top of the agenda.
The direct consequence could be a weaker US dollar. But where should the money flow instead? Into the euro, on a continent where a war is being fought, or into China, which is still struggling to emerge from its real estate crisis and is governed by a difficult-to-predict authoritarian regime? The United States may be fortunate that all available alternatives currently appear even weaker.


.webp)





.jpeg)




.jpeg)

.svg)


