
Chart of the Week
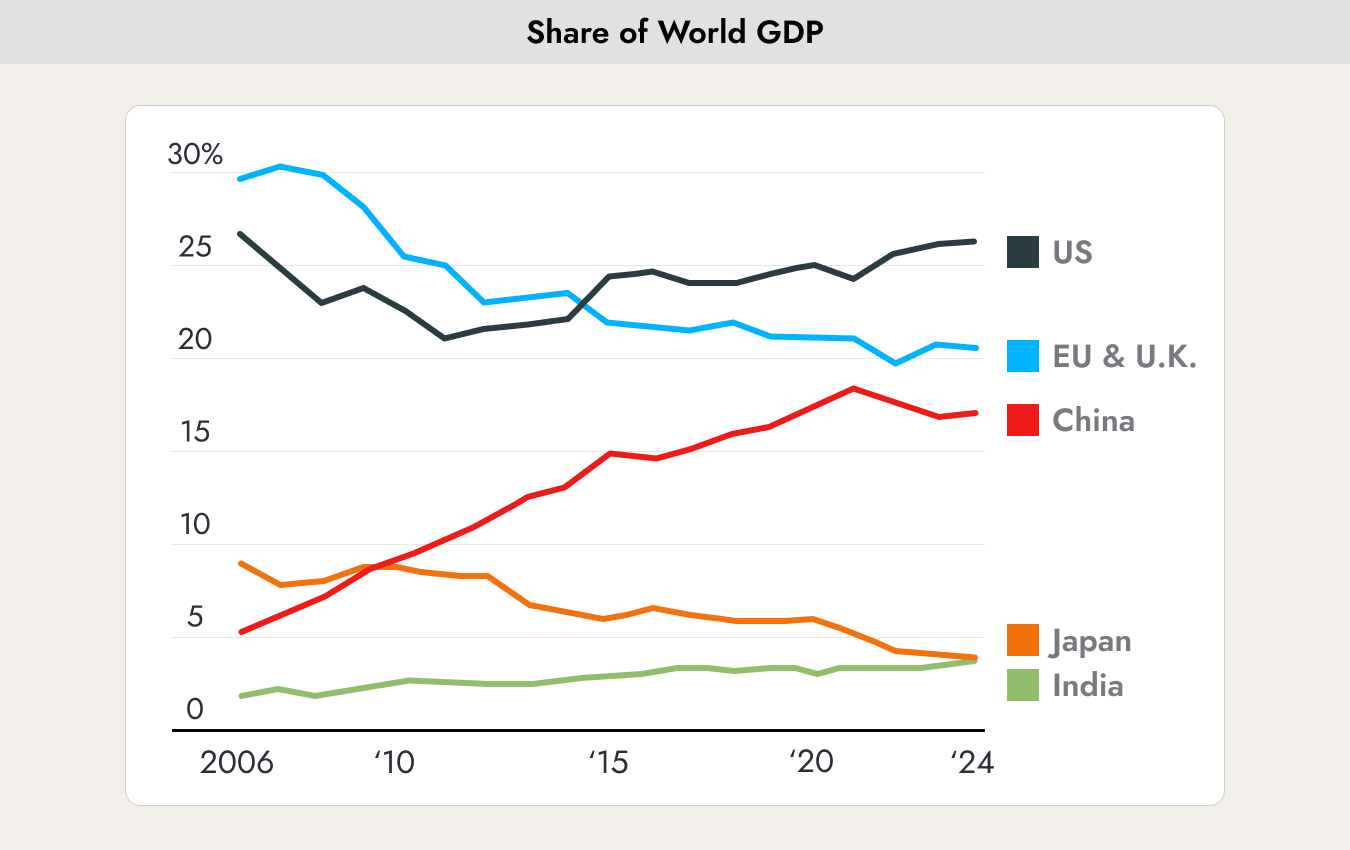
The chart shows each country’s or region’s share of global gross domestic product (GDP). The United States (black line) has been the world’s largest economy for the past 10 years and continues to expand its lead. All major new products and services that have significantly changed our lives have come from the U.S. (Apple, Amazon, Google, Facebook, Tesla, NVIDIA, etc.). Europe remains stable in second place (blue line). China (red line) had been on a rapid rise, and many predicted it would overtake the U.S. as the world’s largest economy. However, the COVID crisis and the subsequent real estate crisis slowed China down.
A process of deglobalization, also referred to as onshoring, is currently taking place in order to reduce political dependencies. Foreign companies are now building only a limited number of new factories in China, while increasing investments in Eastern Europe, the United States, and Mexico.
Japan (brown line) has been on a downward trajectory for nearly 20 years. Japan’s share of global GDP has steadily declined. In contrast, one country that continues to consistently increase its share is India (green line).
Why This Matters
These global developments are important when determining the proper country and regional weighting within an investment portfolio. However, the chart above reflects the past. How will this picture evolve in the future?
One useful indicator is to look at which countries or regions are filing the most patents, since patents often represent the products and technologies of the future.

The United States is clearly leading as a country when it comes to new patents. The figures are from 2022. China likely narrowed the gap somewhat in 2023 due to new patents in the artificial intelligence sector. Because China has fewer data privacy regulations, much more is possible there than in the United States or Europe.
What is somewhat overlooked in the statistics is that Europe as a whole still ranks ahead of the United States.
The conclusion regarding the development of global GDP share: The United States is likely to remain firmly in the leading position. Europe, and Germany in particular, should not be underestimated. China is also expected to remain among the leading economies, but it is unlikely to overtake the United States and Europe anytime soon.
In global equity benchmarks, the United States accounts for more than 60% of the weighting. Maintaining a similar weighting in a portfolio is therefore advisable.
The growth outlook is showing further cracks.
Last week, several economic indicators were published in the United States. In summary, economic growth came in lower than expected (1.6%), while inflation was higher than expected (3.6%).
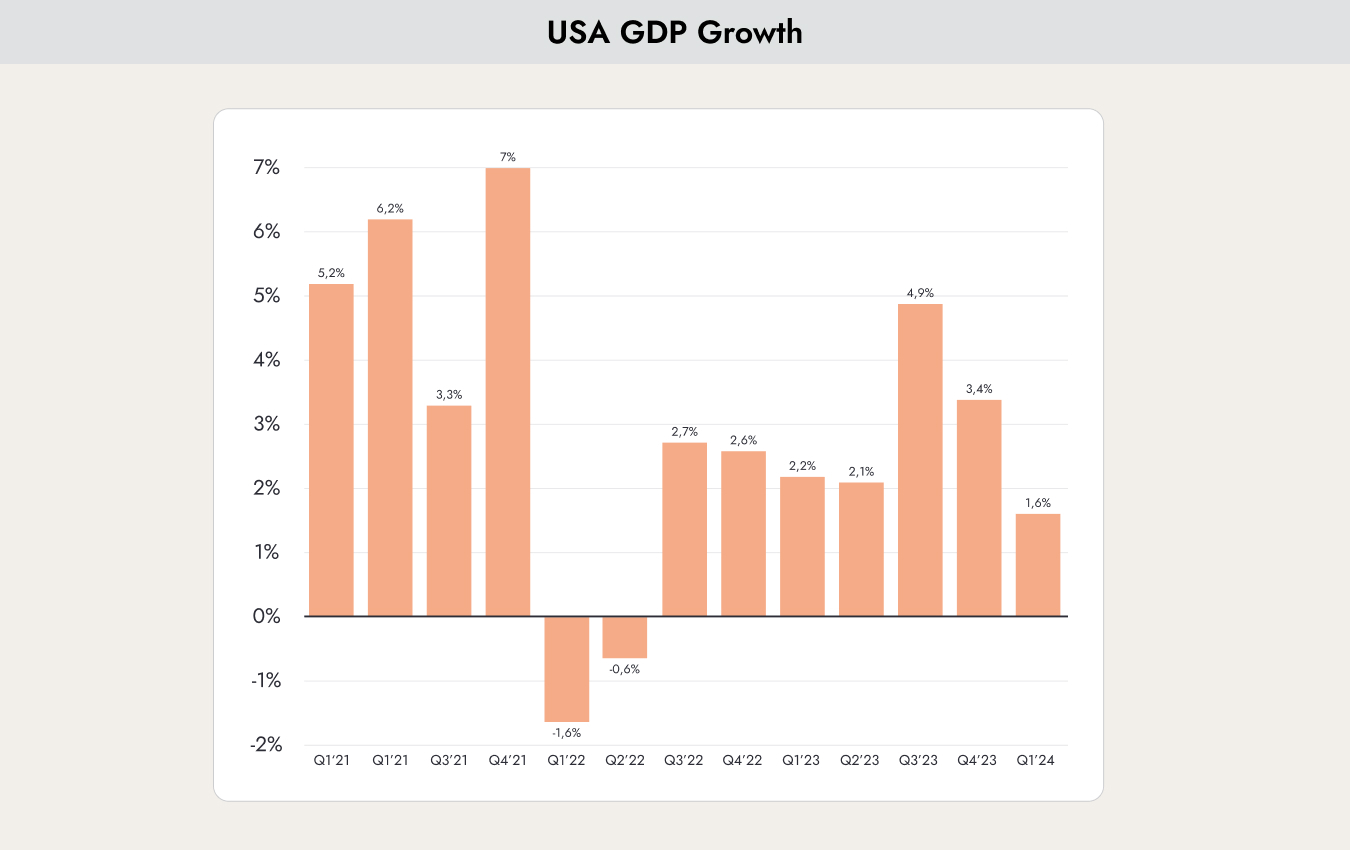
The chart shows the growth of the U.S. economy over recent quarters. For the first quarter of 2024, growth of more than 2% had originally been expected. However, growth of only 1.6% was ultimately reported.
Growth remains positive, and there are currently no signs of a recession. However, growth is lower than expected. Weak growth combined with persistently high inflation is not a very positive scenario. This type of environment is known as stagflation — a combination of stagnation and inflation.
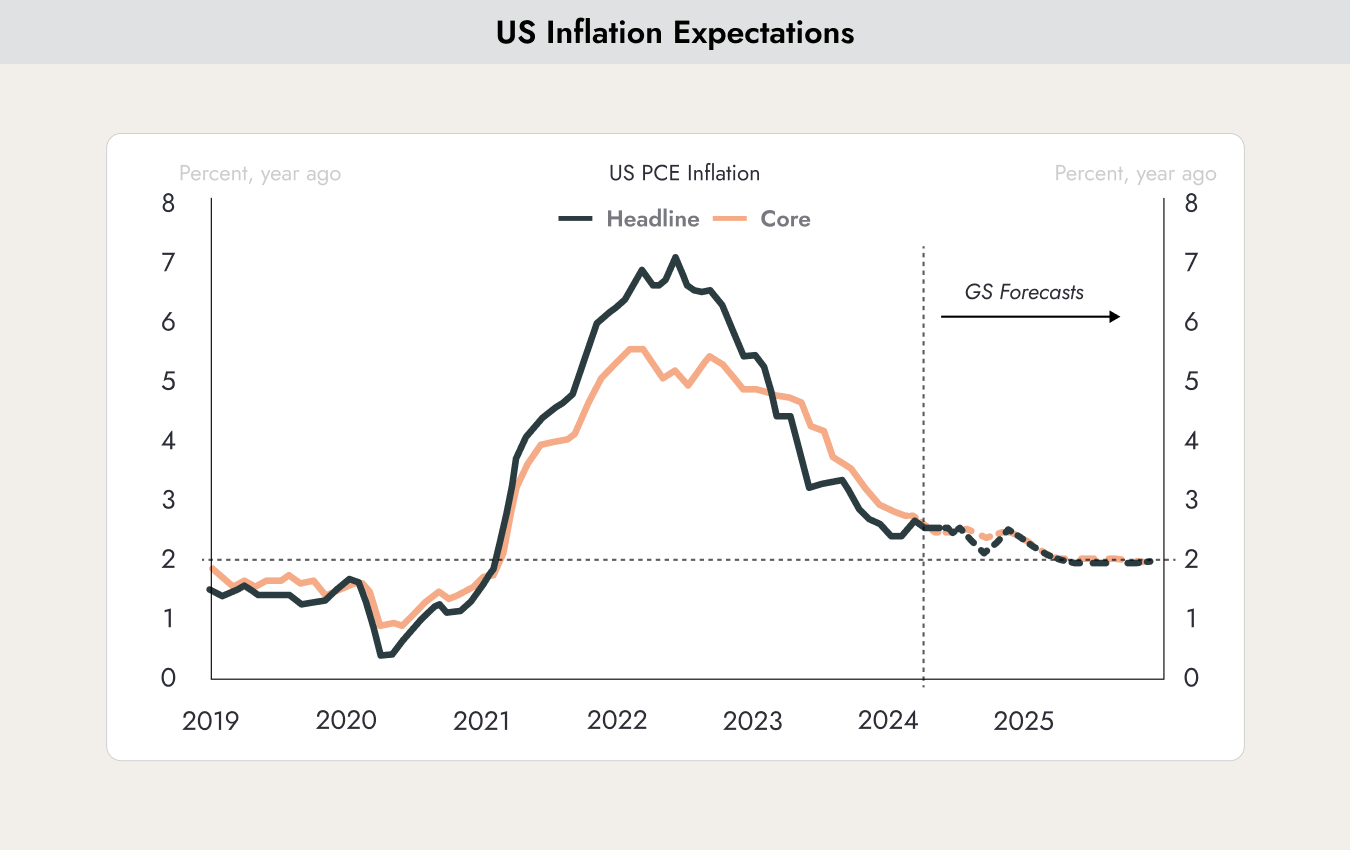
The chart shows the development of inflation (blue line) and core inflation (red line — inflation excluding the volatile energy and food prices) from 2019 to today. To the right of the vertical line, you can see the forecast from investment bank Goldman Sachs. This closely reflects the current market consensus.
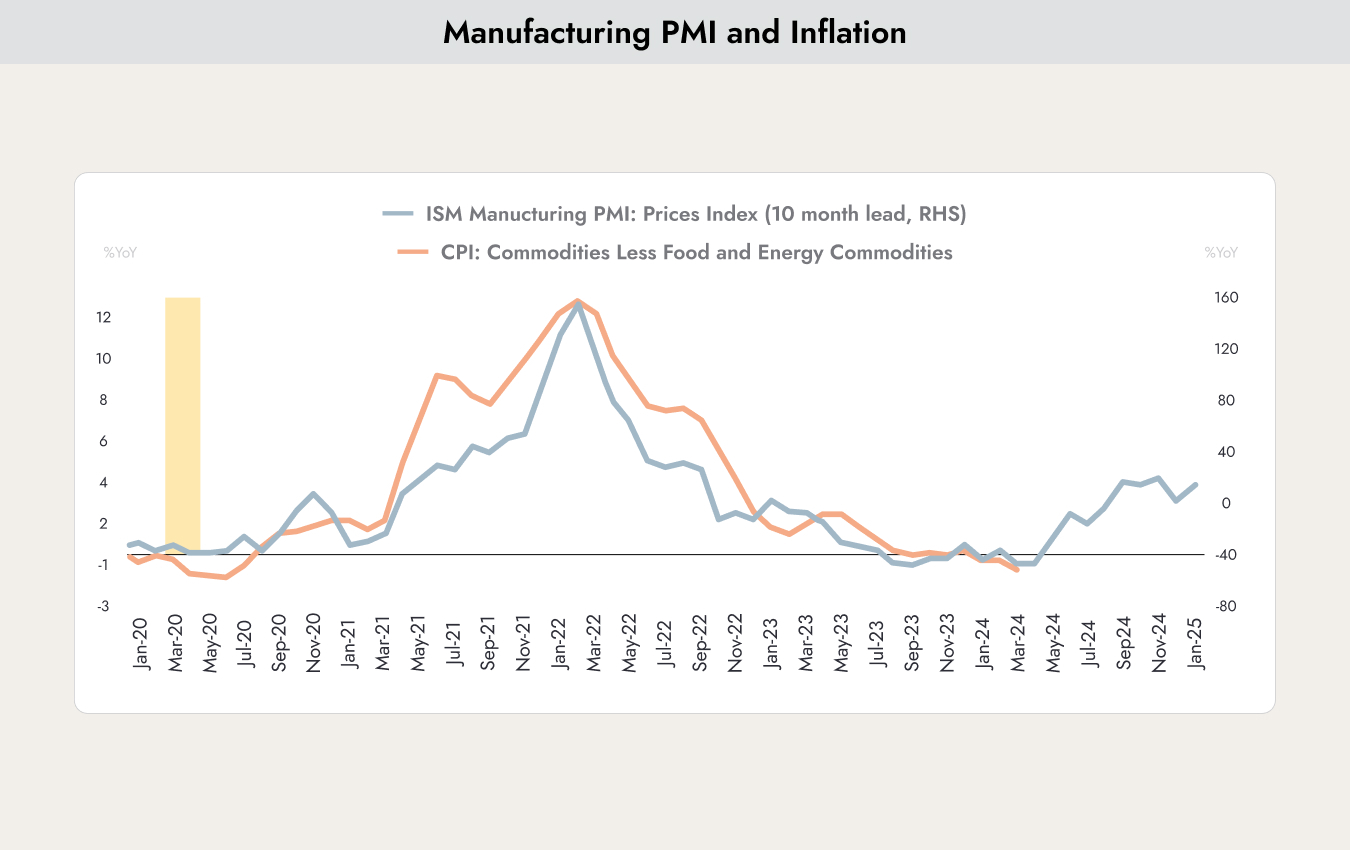
The chart shows the development of the U.S. Purchasing Managers’ Index (ISM) and inflation (CPI). Historically, the purchasing managers’ index of large companies has tended to lead inflation trends by around 10 months. This makes sense, as it usually takes several months for companies to pass higher costs on to consumers. Based on this relationship, the data suggests a tendency toward higher inflation in the coming months.
This now contradicts the forecast from Goldman Sachs. We are convinced that inflation will not continue to decline steadily as previously expected. This is likely to weigh negatively on stock prices in the coming weeks. The probability of interest rate cuts is also expected to decline further.
What also supports this rather negative outlook is the sentiment among small businesses in the United States. Around 60% of all jobs in the U.S. are created by small businesses, not by large corporations such as Apple or Tesla.
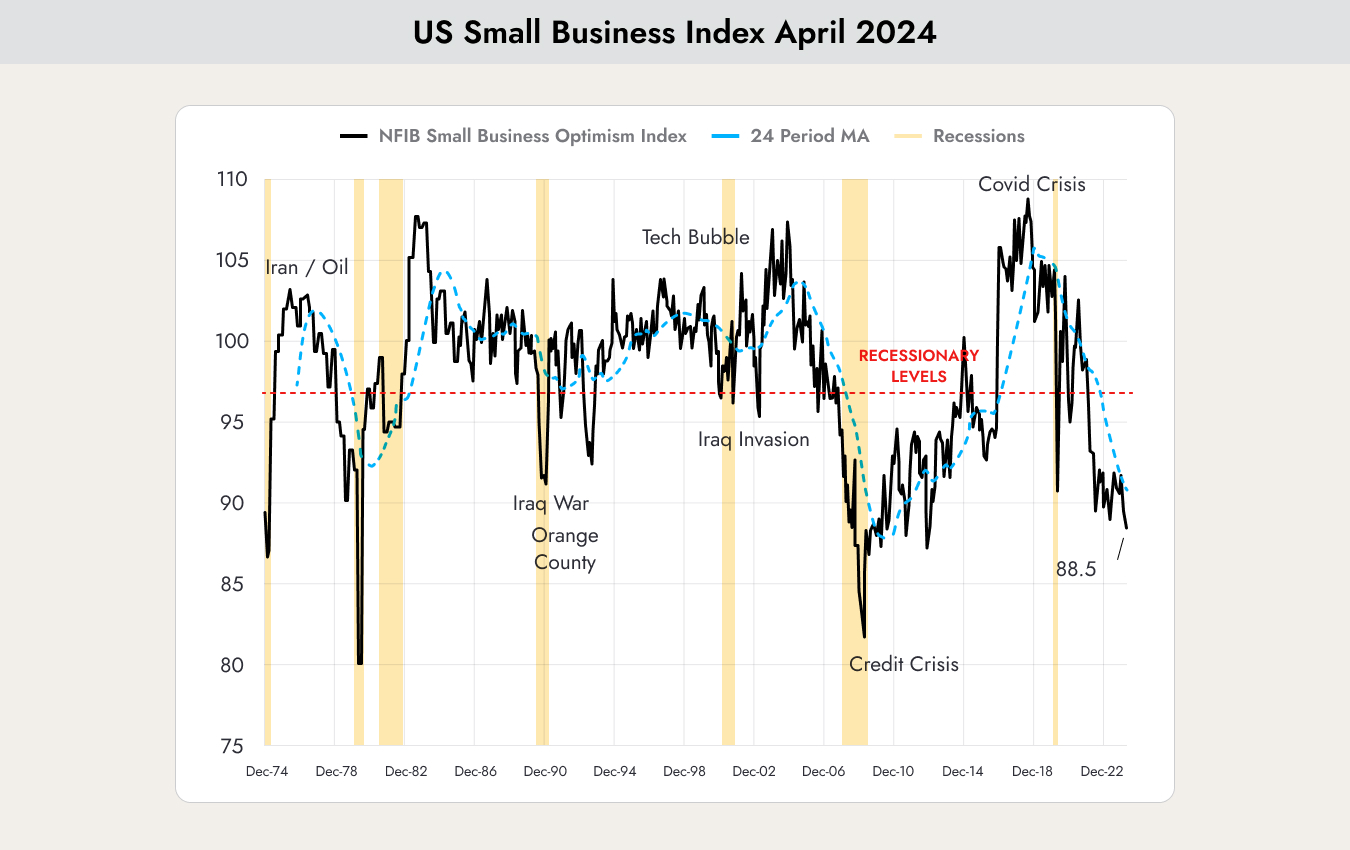
The chart shows the development of the U.S. Small Business Confidence Index. Confidence among CEOs of small businesses regarding the future economic outlook is currently very low. It was lower only in 1978 and during the 2007–2009 financial crisis.
If some of the large companies now begin to weaken and start laying off employees, the rest of the U.S. economy may not be able to offset the impact, potentially causing the downward spiral to continue.
In the meantime, interest rates remain high. On May 1, the U.S. Federal Reserve decided to keep interest rates unchanged.

The chart shows the development of interest rates for 30-year mortgages in the United States. In 2021, these rates were still at 2.6%, but they have now risen to over 7%. Homeowners who need to refinance their loans are facing significantly higher costs.
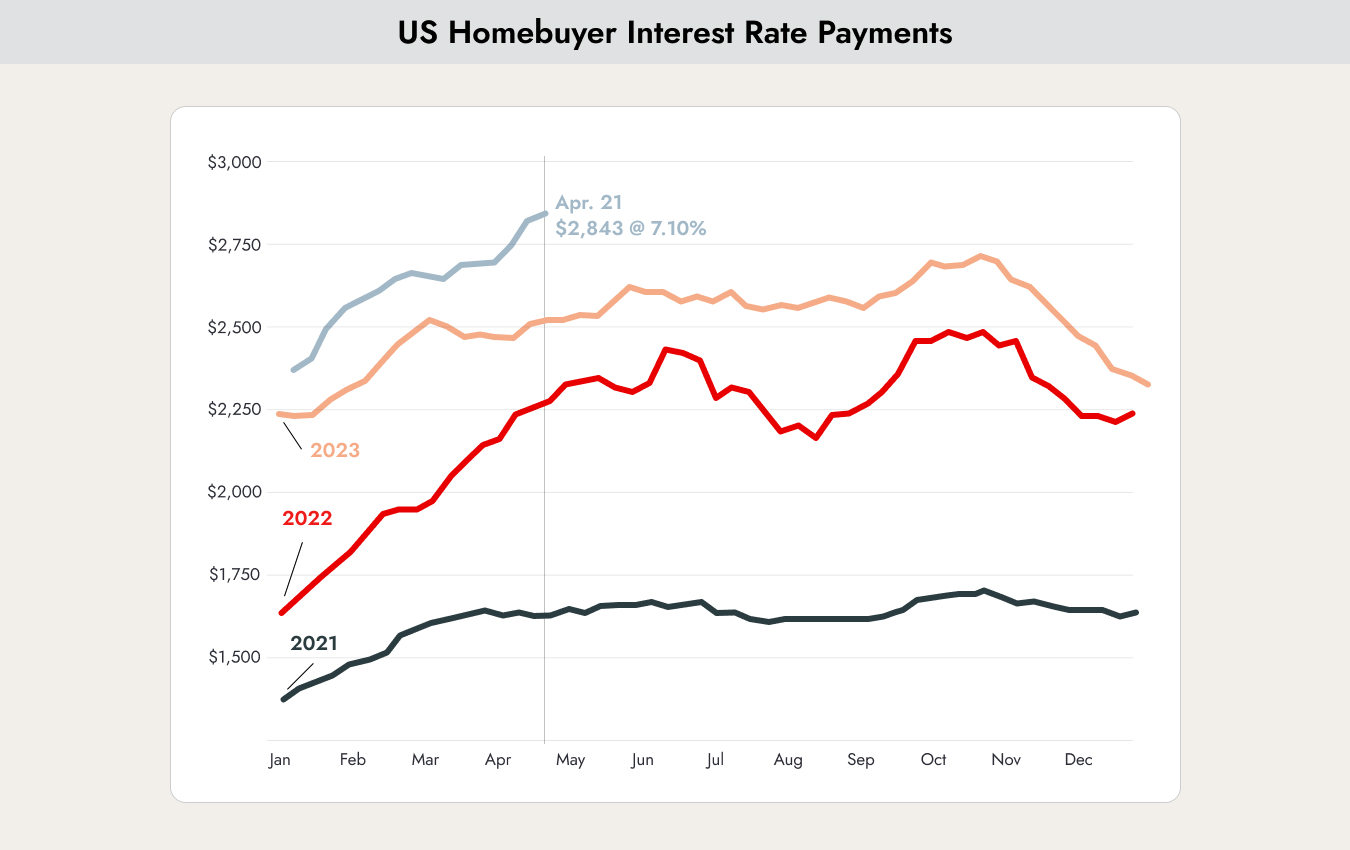
The chart shows how costs change for mortgage holders when taking out a new mortgage. Compared with 2021 (black line), the amount today (light blue line) has multiplied significantly.
The longer interest rates remain high, the more painful the situation becomes, as it affects an increasing number of borrowers.
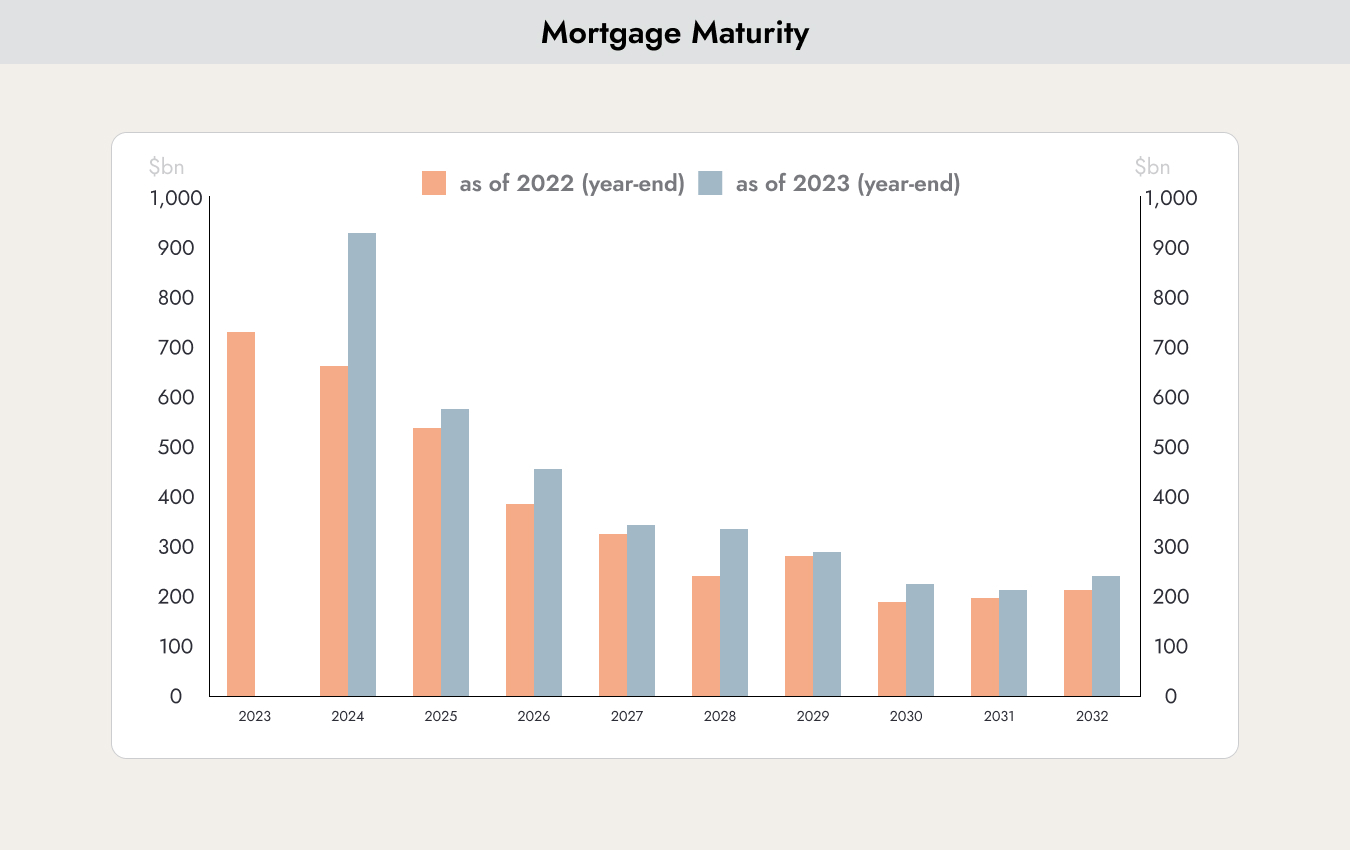
The chart shows the number of mortgages that are expiring and need to be refinanced. In 2024, the number is significantly higher than in 2023. The gap between the orange and blue bars also suggests that many borrowers in 2022 and 2023 opted for short-term loans in the hope that interest rates would soon decline. These borrowers are now being hit even harder in 2024, as interest rates have continued to rise.
Rising mortgage costs are likely to mainly affect middle-class consumer spending. Over the coming months, consumption is therefore more likely to decline than increase.
The overall picture painted by the data points to continued market volatility. We are therefore maintaining our cautious strategy, focusing on value stocks while keeping a high cash allocation.


.webp)





.jpeg)




.jpeg)

.svg)


