
Chart of the Week
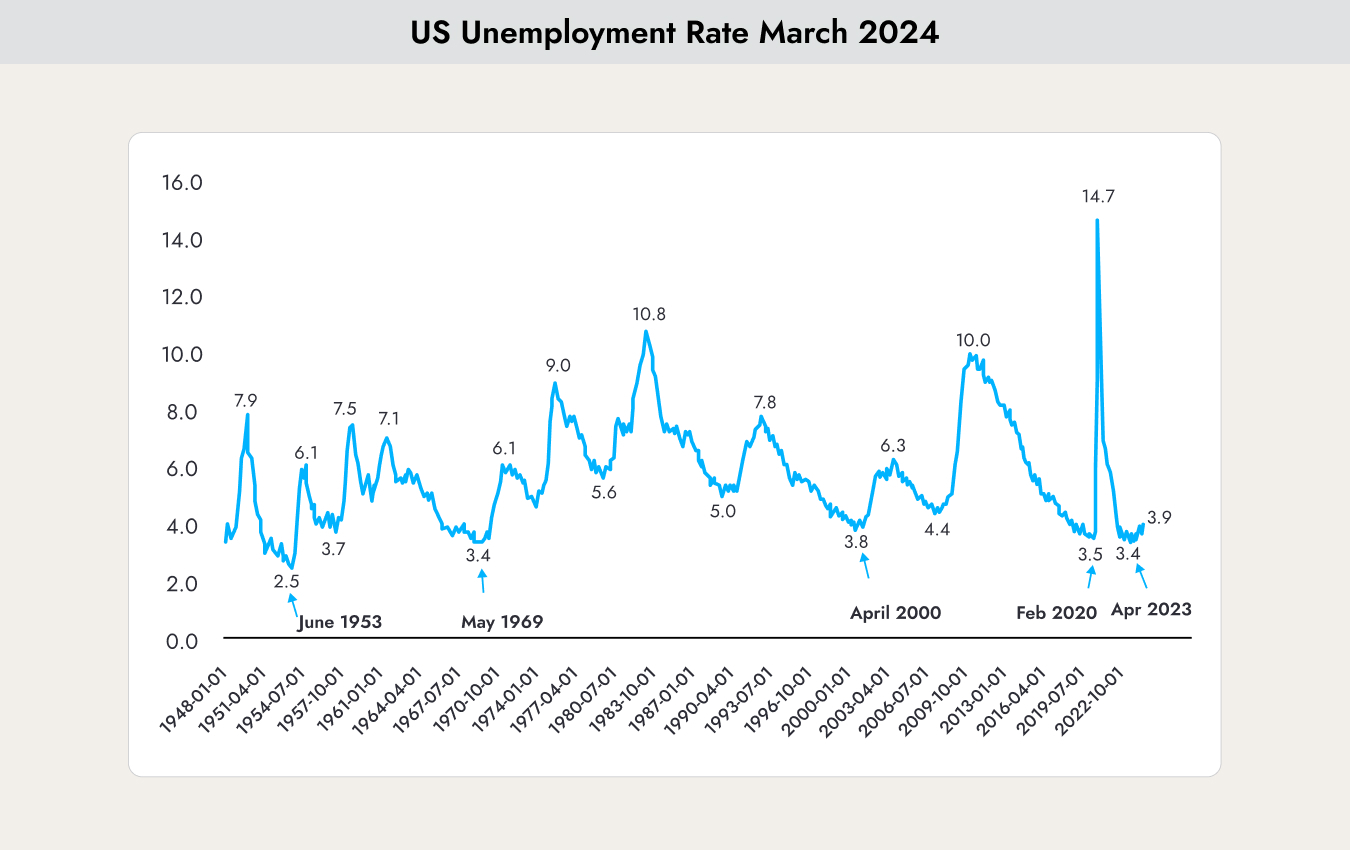
Last week, the number of newly created jobs and the unemployment rate in the United States were published. The number of new jobs created came in slightly higher than expected, but the figures for January and February were revised downward. As a result, the unemployment rate increased from 3.7% to 3.9%.
Why This Matters
Is this now the turning point in the labor market? After an increase in unemployment, it has only happened twice in history, in 1953 and 1968, that unemployment later fell to an even lower level again.
It is also a growing concern that most of the newly created jobs are not full-time positions.
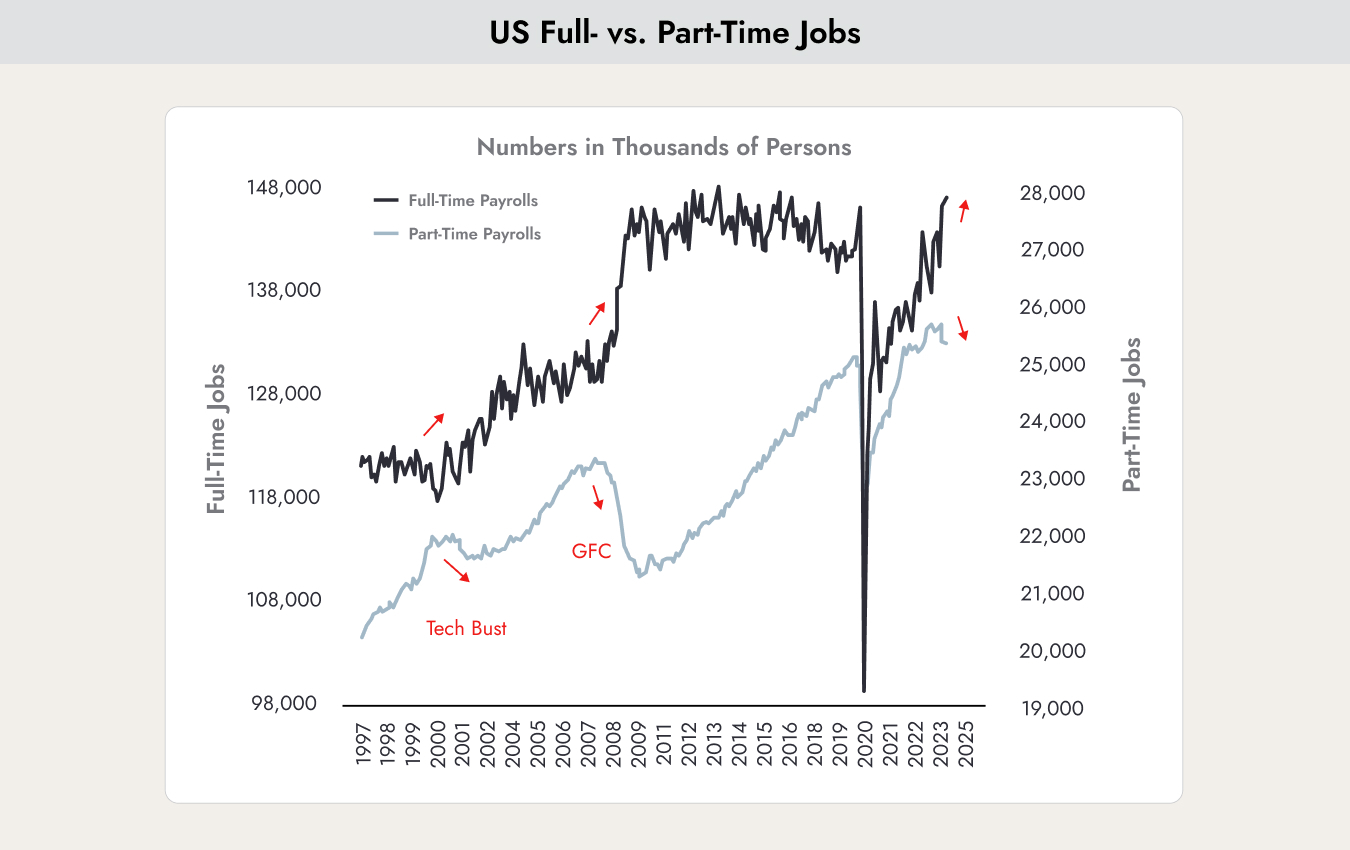
The chart shows the development of newly created jobs, broken down into full-time positions and reduced-hour positions. In 2000 before the dot-com bubble and in 2007 before the financial crisis, a similar pattern could be observed. Full-time jobs declined while part-time jobs increased. The question is whether this is driven by employees being satisfied with working at 80% capacity, or whether companies are optimizing costs because they do not believe in a stable economic outlook.
The unemployment rate carries greater importance in the United States than in most other countries. In nearly all countries, the central bank’s primary objective is to control inflation. In the United States, however, the central bank is tasked not only with controlling inflation, but also with keeping unemployment low. The weak labor market data immediately revived expectations of potential interest rate cuts.
The Mainstream Media and Its Investment Recommendations — Why It Is Often Wrong
Last week, we wrote about why the mainstream media is so often wrong with its forecasts and highlighted several examples.
.jpeg)
We published the article one week too early, because one of the most widely read financial magazines in the United States provided an even better example that same week.

The cover of the financial magazine Barron's featured the headline this week: “Bet on the Bull — Stocks Are Destined to Keep Rising.”
The stock market rises when more investors are buying than selling. Headlines like these encourage even the last remaining hesitant investors to buy. As a result, such cover stories are often a warning sign of a trend reversal in the following weeks or within one to two months.
No Recovery in the US Housing Market
Largely overshadowed by the euphoria in the stock markets, the US housing market continues to deteriorate. Persistently high interest rates are creating difficulties for everyone who needs to refinance.
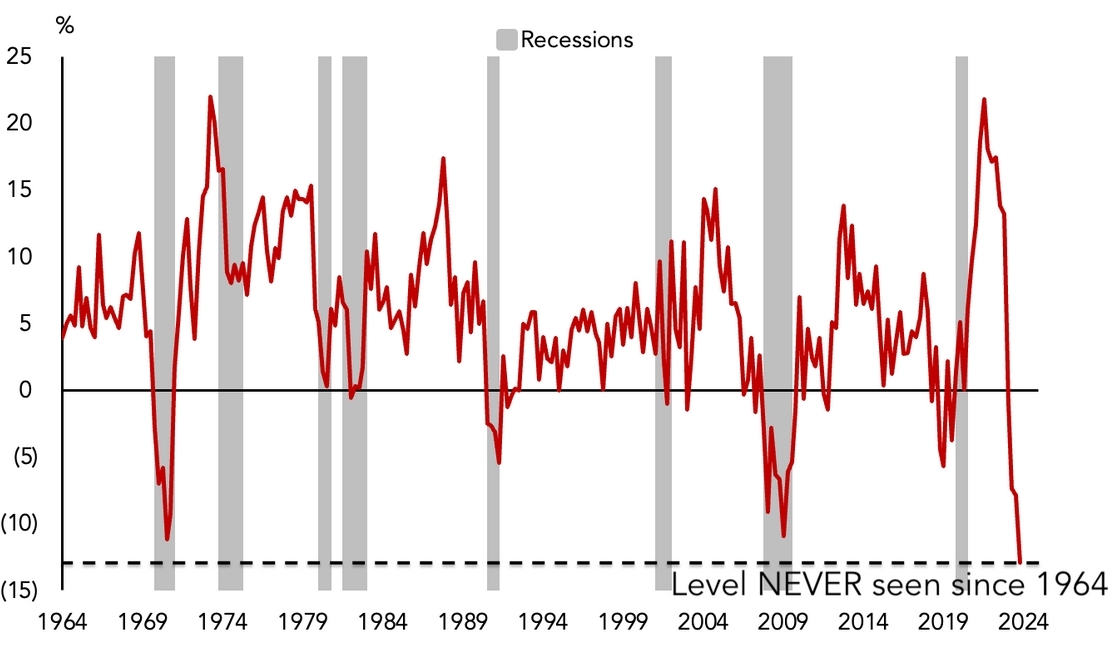
The index shows the median home prices in the United States. Prices are falling more sharply than during the 2007 to 2009 financial crisis, which was itself triggered by the housing market.
.jpeg)
The chart shows the number of multifamily properties financed by the government-backed mortgage lender Freddie Mac that are no longer able to pay their interest obligations. We are already at the highest level since 2013, although still below the peaks seen during the financial crisis.
Although the economy is still performing well and the unemployment rate remains low, the crisis in the housing market continues to intensify.
Bitcoin Reaches New All-Time Highs
Bitcoin is back at new all-time highs. This means that everyone who has ever bought Bitcoin and held onto it is now in profit. Or, put more painfully: everyone who once held Bitcoin and sold it at a loss would now be back in profit as well. There is a saying on Wall Street: “The boom nourishes the boom.” Everyone currently holding Bitcoin is speaking positively about it. That, in turn, motivates many investors to enter the market again.
We have written about Bitcoin several times before — once in November 2023, when Bitcoin has since risen by 93%, and again in January 2024, after which Bitcoin climbed by more than 60%. On both occasions, we pointed to the halving event and the spot ETFs.
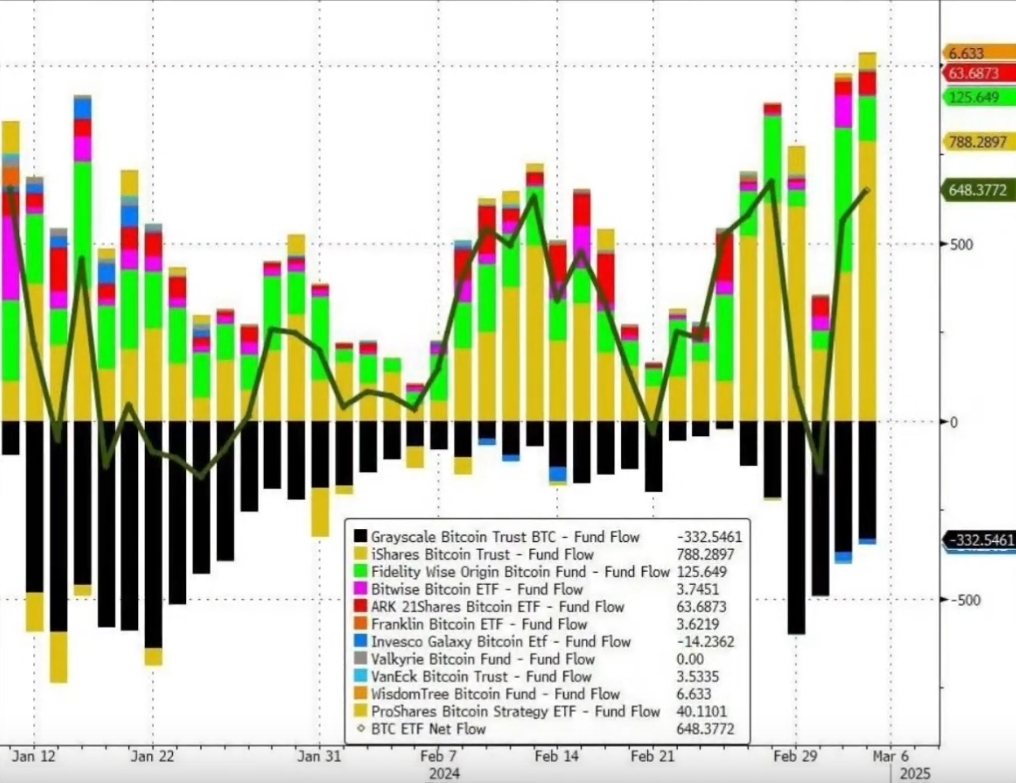
The chart shows the large capital inflows into the American spot ETFs for Bitcoin. The bars above the zero line represent purchases, while the bars below the zero line represent sales.
Since the launch of the spot ETFs, around USD 10 billion has already flowed into these products. This means that USD 10 billion worth of Bitcoin has effectively been removed from the market and is being held as collateral. This inflow of capital has changed the market dynamics and played a major role in the price increase.
A large part of this effect, however, has been offset by Grayscale Investments (the black bars in the chart). Grayscale operated the first and currently largest Bitcoin trust. The reason they have been selling Bitcoin is linked to the bankruptcy of major crypto companies such as Genesis. In recent days, the bankruptcy administrators approved the sale of Genesis holdings in order to repay creditors. However, once Grayscale has sold off its remaining holdings, the ETFs will need to acquire Bitcoin directly from the market.
When large ETFs acquire Bitcoin, they rarely buy through public exchanges. Instead, they typically purchase through over-the-counter transactions (OTC) via market makers and trading firms.
.jpeg)
The chart shows the Bitcoin holdings maintained by large market makers, which they sell to ETFs through OTC transactions. These holdings are currently at historically low levels.
The market for Bitcoin is like any other market: when there are more buyers than sellers, the price rises. Supply is already, or will soon be, almost completely drying up in the coming weeks, while demand continues to increase due to the spot ETFs.
And in 40 days, the halving will follow:
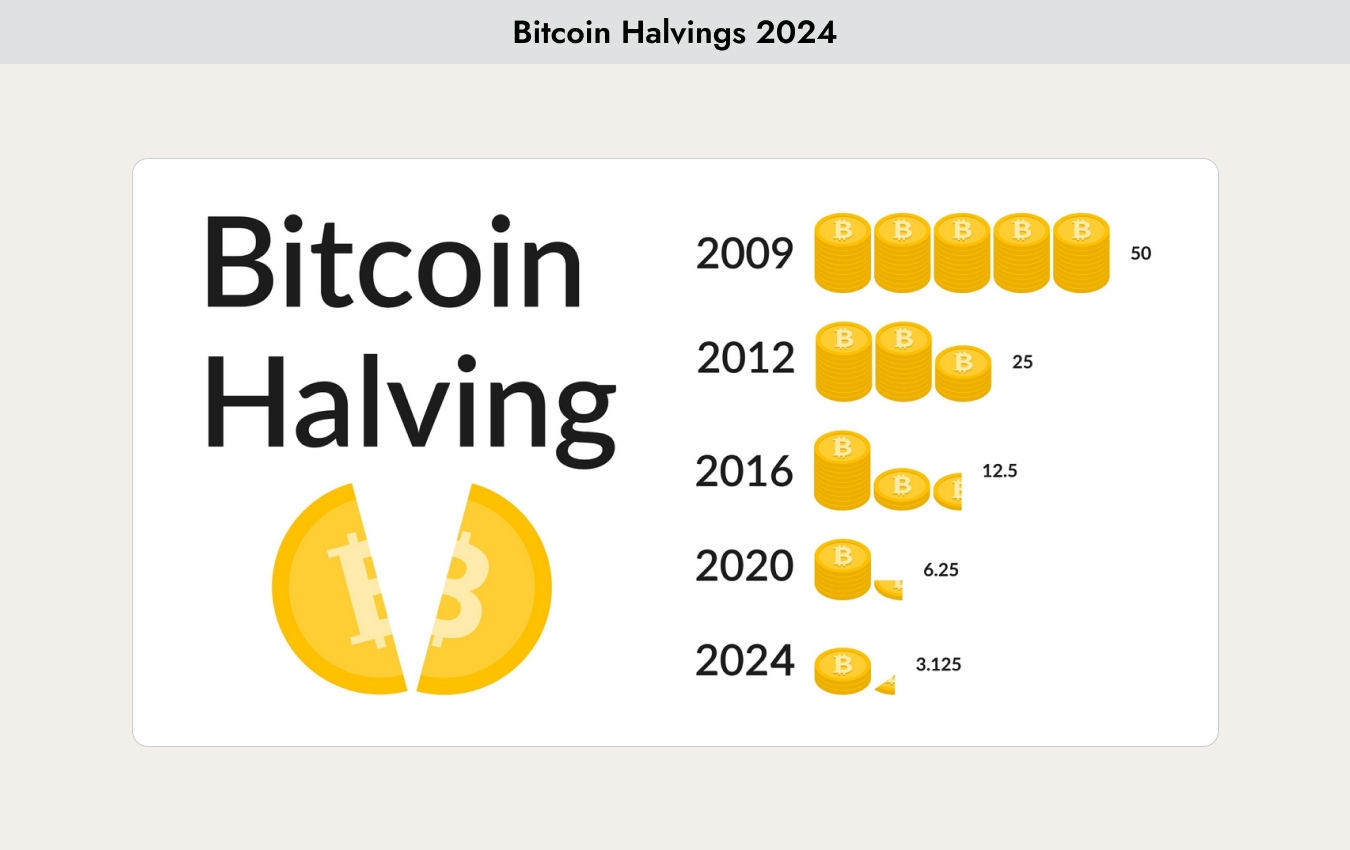
The chart shows the previous halving events. Bitcoin is a decentralized currency designed so that no central authority can control or manipulate it, unlike central banks. There are currently around 18,825 nodes. These function like distributed ledgers on which every transaction must be recorded. When someone pays with Bitcoin, the payment is only considered completed once the transaction has been entered across all 18,825 ledgers. This process requires significant computing power. Users who provide this computing power are rewarded with Bitcoin, and this process is known as “mining.” The reward structure has been fixed since Bitcoin was created and is regularly cut in half — an event known as the halving.
The chart shows the price development of Bitcoin since 2011 and the previous halving events (green circle, 1). In the past, Bitcoin has consistently experienced a price increase in the six months leading up to a halving. This upward momentum usually accelerated further after the halving. However, two to three weeks immediately following the halving, a correction of around 10–30% has typically occurred before the price resumed its upward trend.
It is also interesting to observe how long the price increases lasted. So far, the halving has almost always marked roughly the midpoint of the overall upward price cycle (red arrows, 2). Based on the current figures, this would suggest that Bitcoin could continue rising until around early September 2024.
The next reward halving is scheduled for April 21, 2024 (Halving Countdown). This means that, on top of the expected supply shock described above, there will be an additional reduction in available supply for Bitcoin.
For Bitcoin, there seems to be only one direction: upward. Or perhaps not?
As with every market story, however, there is also a catch. What is currently being overlooked in the media is the structure of the Bitcoin market. Around 80% of all Bitcoins ever created have never been traded. This means that the market is currently operating with only about 20% of the total supply actively circulating.
So far, miners have generally held onto their Bitcoin during every correction, and in some cases have even increased their holdings. However, prices are now reaching levels that could tempt some miners to sell. There are many individuals who would become millionaires, multimillionaires, or even billionaires if they decided to cash out.
There is, however, one important limitation. Bitcoin trading platforms are not structured like traditional stock exchanges. Many are domiciled in countries with weak regulations and limited investor protection. Most crypto exchanges also impose restrictions on how much cash can be withdrawn per day. On many platforms, the maximum daily withdrawal limit is around USD 25,000. A fortunate holder with USD 100 million in Bitcoin would therefore need more than 10 years of daily maximum withdrawals to fully cash out their holdings.
As mentioned earlier, every Bitcoin transaction is recorded in a public ledger. This means it is possible to see exactly how many Bitcoins each wallet holds. However, only wallet addresses such as “bc1qp8rx0u6ef9pwg5pa0608e3ggrp5p237cz2dhkw9085etl4ne034ss4s2yt” are visible, not the real names of the users behind them. Still, this allows market participants to track in real time who holds how many Bitcoins. If large holders begin selling, it becomes visible immediately and, depending on who the seller is, this could trigger a wave of panic selling and potentially lead to a complete collapse of the system.
This is also known as the prisoner’s dilemma. If nobody moves, everyone benefits. But if one participant acts first, that person can secure all the gains — or avoid the losses — while everyone else risks losing everything.
Let us hope that nobody makes the first move.


.webp)





.jpeg)




.jpeg)

.svg)


